PUSH Checks – Heartbeats and Metrics Monitoring

One of the most requested features we get is the ability to push monitoring results into NodePing. Today, we make good on all those requests and are happy to announce our latest check type, PUSH.

Unlike our other checks, PUSH checks allow your server to push metrics into our system, track the metrics, and receive alerts based on the results. This significantly adds to your ability to monitor services that are not Internet accessible, and monitor additional custom metrics. Our customers running LANs can now get heartbeats and metrics on internal servers like Windows AD controllers. Or, you can monitor metrics that are only relevant to your systems in ways that are specific to your environment. We’ll track and alert on any metric you want to push at us!

Heartbeats and Metrics

PUSH checks are configured to send results on a specific interval and you can configure the check to fail if we haven’t received a pushed result from you. This is the heartbeat functionality.

You can also push us a data payload of metrics with the PUSH check result and configure your check to track those metrics. The check will fail if any configured metric is missing or if the values in the result are outside your configured min/max range.

Metrics are great for keeping an eye on system load, disk free space, or any other service or system metric you can gather on a server and send to us.

PUSH checks are flexible and can be configured to be heartbeat-only, metrics-only, or both.

PUSH Clients

To send us your result (heartbeat or metrics), you’ll need to submit an HTTP POST to NodePing with information about the check and optionally the metrics. Details can be found in our in our PUSH check documentation.

We’ve got fully-functional, open-source clients in Python2, PowerShell, and POSIX script available on our GitHub public repo that have been tested with the following OSes:

  • CentOS 5 (Python2 and POSIX)
  • CentOS 6 (Python2 and POSIX)
  • CentOS 7 (Python2 and POSIX)
  • Debian 9 (Python2 and POSIX)
  • Devuan 2 (Python2 and POSIX)
  • Fedora 28 (Python2 and POSIX)
  • FreeBSD (Python2 and POSIX)
  • OpenBSD 6.3 (Python2 and POSIX)
  • OpenSUSE LEAP 15 (Python2 and POSIX)
  • Raspbian STRETCH (Python2 and POSIX)
  • Ubuntu 14.04 (Python2 and POSIX)
  • Ubuntu 16.04 (Python2 and POSIX)
  • Ubuntu 18.04 (Python2 and POSIX)
  • Windows server 2012 (Python2 and powershell)
  • Windows server 2016 (Python2 and powershell)

Download a client and follow the instructions in the client README.md file to set up your PUSH client.

An example of the default metrics sent from our POSIX client:

OS load: 1 minute, 5 minute, and 15 minute load stats
Memory free in MB
Disk space free in percentage by mount point.

There are also optional modules for Redis, Cassandra, ZFS, iptables, and more.

All our clients are built so you can add your own modules to push additional metrics – the ones you care about. The requirements for pushing metrics into our system are fairly simple, so you can write your own scripts in your preferred language. It just needs to output JSON data with numeric values. You can find the information you need to create your own client modules in our PUSH check documentation and take a look at existing modules for examples.

We encourage pull requests for new modules so if you build something you think others would find useful, please do share.

We’re working on new reports and dashboards to visualize metrics, making the new PUSH check even more useful, so keep an eye out here on the blog for those announcements.

If you aren’t using NodePing yet, you can sign up for a free, 15-day trial and test out our new PUSH checks yourself. We think you’ll love the new functionality along with our rock-solid monitoring and fast/accurate notifications.

Public status reports updated

We announced the initial release of our public status pages for our web site and server monitoring service a couple of weeks ago. These pages allow you to have a public status page for all of your servers and websites in one place. Since then, we’ve worked to add some additional enhancements that we think will be particularly useful.

First, we’ve added custom domains. This allows you to set up a URL such as https://status.example.com as your public status page. Just add a cname record to your DNS to point the domain to nodeping.com, and add the domain or subdomain to the report settings in your NodePing account (under Account Settings -> Reporting), and the custom URL will be available within 30 seconds or so. Once you have a custom domain set up, all of your public reports are available on that domain.

We’ve also added links to reports on individual check results. Any checks for which you have enabled public reports will include a link on the status page to go to the individual report. At the same time, we tweaked the individual results report so that the long list of results only shows if you click on the “Show Details” button. We got some feedback that the whole list is a little overwhelming, so we’ve made the information still available but not shown by default.

Finally, we’ve made a few cosmetic tweaks to the reports and to the reports settings page.

We have a number of additional features and enhancements we’re planning to add to these reports still, but we hope what we’ve done so far is already useful to everybody. As always, feedback and suggestions are welcome. Let us know what you think at support@nodeping.com, by posting comments here, or by using our Contact Page.

Public Status Pages

One of the frequent requests we get is for a public status page that lists the status of several server monitoring checks in one place. There is a lot to this particular feature, but we’re pleased to announce that the first version of this feature is now available on NodePing.

NodePing Status Report
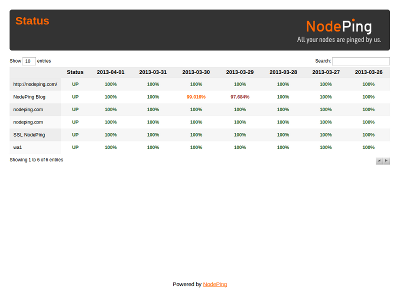
The status report allows you to select any of your active checks for listing on the status page. Any number of checks can be included. Just go in to the Reporting tab under Account Settings and select the checks you want to have displayed. The tab also shows the URL for your status report page.

The report has a “title” field, which is displayed at the top of the page. This field supports HTML, so you can add tags to style the look of the top of the page. That includes using an img tag to show your logo or other branding type information at the top of the page. For examples, you can look at https://nodeping.com/reports/status/MTSL1PQUZC and https://nodeping.com/reports/status/P9H0LI94W7. Script tags and other cross site scripting will be filtered. Provider accounts have additional control over the look of the page using the site branding features.

We didn’t want to just start publishing information without allowing people to opt-in to this featuer, so by default this report is not enabled. Enabling it is just a few clicks.

There are a number of additional features that we plan to add to this report, including more customization, links to individual check result pages, and custom URLs. In the meantime, feedback and suggestions are always welcome at support@nodeping.com.

HTTP Parse Check – Monitor Anything!

Most of the checks that we have released for NodePing to date have monitored specific Internet-based services. These are very useful, and they are the bread and butter of traditional web site and server monitoring services. Today we’re really excited to announce the release of our “Monitor Anything” check. You can use it to monitor… well, just about about anything.

The new check is the HTTP Parse check. It connects to a remote HTTP service and parses the response for specific fields and values. The values are then stored in the check results for reports. If any of the values are outside of your configured ranges, it triggers a notification via email, SMS, twitter, voice call, or webhook.

The HTTP Parse check can look for named fields in text or a JSON response. For example, if the check is configured to look for a field named “llamas” and the response contains llamas: 34 then the system will store 34 as the value, which will be displayed on reports and charts.

Similarly, the response could be in JSON format. For example, the JSON could be something like this: {"animals": {llamas": 34}} Configuring the check to look for animals.llamas will store 34 in the check results. The check can handle multiple fields, as long as they are all accessible from one request to a URL, and it can pull values from the middle of a larger response.

What could this check be used for? Anything that is accessible by an HTTP request that returns a field with a numeric value. Since it is parsing the response for the field name and value, it can be embedded in other data. This means that any JSON API or data service on the Internet is potentially a target for this.

Sample Server Load Output
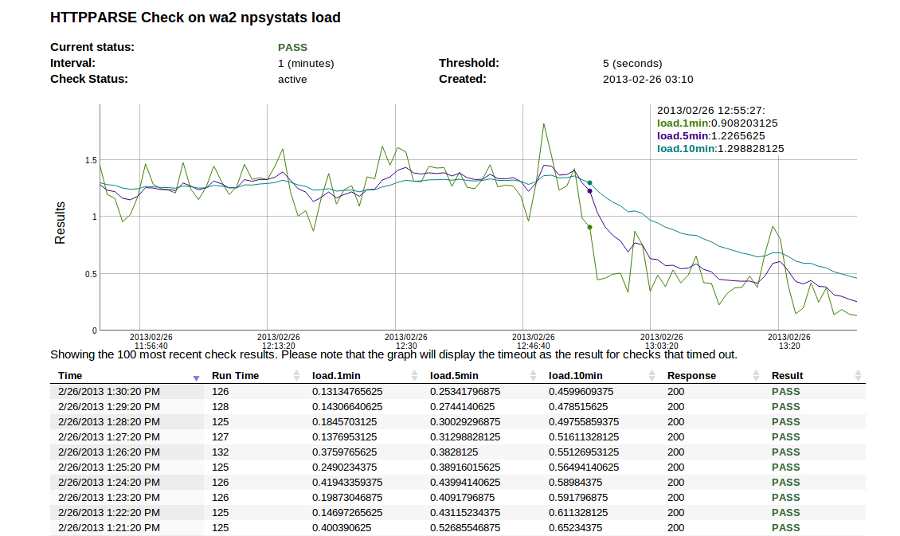
Our use of this check at NodePing is to monitor server health. As you can imagine, running a service like NodePing means we have a number of servers all over the place. We use this check to monitor server load, free memory and disk space on a number of our servers.

There are many ways to generate the system information from a host so it can be used for this check. Some of the ones we’ve tried include Linfo and phpSysInfo. We wanted a similar tool written in Node.js, so we wrote npsystats, which is what we now use for our systems. We’ll have more to say about npsystats in the near future. There are a number of other similar tools out there, such as Ohai in Ruby. The HTTP Parse check is capable of working well with most of them.

For example, we have a check on a web server that monitors server load. npsystats returns the following json in response to the check’s HTTP GET request:
{"load":{"1min":1.86376953125,"5min":0.9501953125,"10min":0.64404296875}}
The check is set to watch three fields: load.1min, load.5min, load.10min, with a range of 0 to 8 (it could be different for each field, but it doesn’t have to be). So if the load on this server goes over 8, I will get an email. I also can access a graph showing the 1, 5, and 10 minute load for this server.

More information can be found in our documentation for the HTTP Parse Check. We think this makes NodePing an even more awesome piece of your system monitoring and automation toolkit, particularly when tied to judicious use of notifications and webhooks. If you don’t have an account on NodePing yet, try it out with our 15 day free trial.

Don’t let your certificate expirations catch you offguard

Microsoft’s recent slipup with a certificate that caused outages for the Azure service is a reminder for the rest of us to make sure we are keeping a close eye on certificate expirations. Having a certificate expire on you makes you company look really inept, but in practice keeping track of certificates and when they expire can be a pain if you are trying to do it manually. A system that monitors certificates and reminds you before they will expire can be an excellent way to avoid having this happen to you, and is much easier than tracking them in a spreadsheet or sticky notes.

NodePing provides a few different ways to keep ahead of certificate expirations. For web servers, we have an SSL Check specifically designed to check the validity of SSL certificates and warn you a set number of days before they expire. You can set the number of days to anything that is useful for you. We typically suggest a couple of weeks in advance of the expiration.

Certificate expirations can also hit other types of services as well. Our email checks (SMTP, POP, and IMAP) can verify the SSL/TLS certificates used by each of these servers. Similar to the SSL check for web services, these checks verify that the SSL certificate is valid and working, and also can be set to warn you a certain number of days before they expire.

Tracking your certificates can be a pain, but it doesn’t have to be. Using an automated monitoring system like NodePing for SSL Certificate monitoring can make the task easy and painless, and let you focus on more interesting things.

SIP Monitoring

If you run SIP servers, you’ll be pleased as punch to know we’ve just released a new SIP server monitoring check just for you. Now you can be alerted if your SIP server goes offline or isn’t responding to SIP commands.

SIP stands for “Session Initiation Protocol,” and refers to a signaling protocol that can run over TCP or UDP and is commonly used for voice and video communications. SIP servers are often the connection points for VOIP calls.

The check does not initiate a call, but rather tests that the the server accepts a SIP connection by sending the OPTIONS command and watching for the response. Even if your server does not support the OPTIONS command and returns an error, this indicates that the server is up and operating, so the check succeeds. You can find more information about this check in our SIP Check documentation.

This new SIP check is available today for all NodePing accounts. If you don’t have a server monitoring account with NodePing yet, head on over and sign up for our free 15-day trial.

Introducing NodePing’s Monitoring API

This is Part 1 in a series of posts we’ll have in the coming weeks detailing various aspects of NodePing’s new API. The API allows customers to manage most aspects of their site and server monitoring through an HTTP accessible RESTful interface. It provides list, read, write, and delete functionality for subaccounts, contacts, contact groups, and checks, as well as allowing you to retrieve checks and notifications. Access to the API is included in our service at no extra cost.

The API supports HTTP methods for most calls:

  • GET for listing or retrieving specific records,
  • PUT to update a record based on its ID,
  • POST to create new records (IDs are assigned automatically), and
  • DELETE to delete records.

All responses are JSON.

The API’s authentication is token based. You can find your token in the Account Settings area of your account, or if you’re logged in to the service it is also displayed on the Documentation page.

Documentation is available at https://nodeping.com/API_Documentation. Reference docs showing all supported calls are at https://nodeping.com/API_Reference.

Here’s an example of updating a monitoring check:
curl -X PUT -d'json={"threshold":4, "target":"http://www.example.com/index.html", "enable":"true", "notifications":[{"SKTUSP":"Days"}]}' 'https://api.nodeping.com/api/1/checks/201205050153W2Q4C-1FOC0YYM'

The response to that call would look something like this:

{
  "_id": "201205050153W2Q4C-1FOC0YYM",
  "_rev": "4-5069940f2a95fc6ae5564e329da755bd",
  "customer_id": "201205050153W2Q4C",
  "label": "Site 2",
  "interval": 1,
  "notifications": [ { "SKTUSP": "Days" } ],
  "type": "HTTP",
  "status": "modified",
  "modified": 1337744587374,
  "enable": "active",
  "public": false,
  "parameters": {
    "target": "http://www.example.com/index.html",
    "threshold": 4,
    "sens": "2"
  }
}

Since the API is brand new, we would really like to hear from people who start using it in real situations. Please let us know what works well, and what we could do to make interacting with the API easier.

6 Sources of Residual Income for the Web Developer

Most web developers I know are hired for site creation, or re-creation and when the job is done, that’s the end of the revenue from that client until something is broken or some other change needs to happen. But with a little extra effort on your part, you can transition a ‘project’ client into residual income. Not only will this keep a steady flow of cash coming in, but you’ll be able to more easily maintain those valuable relationships with your clients so when the next site or re-design happens, you’ll be the one they call.

Consider adding or packaging a few of the following ‘services’ with your development pitch.

  1. Hosting
    Chances are, you’re already doing some of this. The ability to hand over a turn-key website solution makes it easy to add the ‘web hosting’ line item to your bill. Given the low cost of shared hosting like Bluehost or  HostGator, you can easily charge a modest monthly hosting fee and make a nice margin on it. If you don’t ‘do’ hosting – sign up as an affiliate on a hosting company you recommend. Affiliate programs typically give you a commission for sending them customers. It’s easy to do and doesn’t cost anything. Heck, the two links in this paragraph are affiliate links – so go sign up! <grin>
  2. Monitoring
    If the site is worth developing and hosting, it’s worth keeping an eye on. No matter who the host is, your client (and you, if you’re hosting it – see #1) should be the first ones to know if it has gone down. Get yourself a website monitoring account at NodePing (come on, you saw that plug coming a mile away). For only $10/month, you can set up 1000 URLs to keep an eye on. Resell some of those checks to your client – charge them whatever you think is fair and they’re willing to pay. Set your client up as a ‘Notifications Only‘ contact and they’ll get an email or SMS whenever the site goes offline – and when it comes back up too. With NodePing’s new public reports, you can create a URL on your branded website and iframe in the public report so your client can bask in the glow of their uptime graph. If you don’t know how to iframe one page into another, you’re not the target audience of this blog post – but just in case, here’s a link on how to iframe.
  3. SSL Certificates
    If your client’s site has a login form, they’ll need an SSL certificate. The ease of wireless ‘sidejacking’ using Firesheep and similar tools, you should know better than to have a non-SSL login form. Like hosting you can either resell SSL certificates directly or sign up to be an affiliate and earn a commission (usually a percentage) of your client’s spending. Unlike hosting, it takes quite a bit more hoop jumping to become a reseller but with the price of certs and the fact that they need to be re-issued on a regular basis it’s worth the effort.
  4. Payment Processing
    The least fun part of developing ecommerce solutions is the payment gateway integration. Typical reseller/affiliate programs with payment gateways include a percentage of the setup fee, a percentage of monthly fee, and even a per-transaction cut. While Braintree is definitely our preferred gateway here at NodePing (great API and low costs), they unfortunately don’t have a reseller/affiliate program so you may want to stick with some of the old guards like Authorize.net.
  5. Backups
    Your client will need ‘offsite’ backups of their sites and databases. Most of the cheaper hosting companies don’t provide adequate backups, which provides you with an opportunity to sell a much-needed service to your client. Drive Headquarters has a generous referral program and offers both client and server backup capabilities that are very script-able. Just be sure you know how to restore the site from those backups.
  6. Timeshare in Vegas
    OK, this one is just for laughs.  Timeshares are like boats – everybody I’ve ever known who bought one, has also sold one.

If you started adding auxillary services like those above, you could easily see a $100/month/client jump in revenue for just a wee bit of your time in administrating… multiply that times your current client base and you just got a nice raise!  Felicidades!

More importantly, providing extra services will help you maintain a relationship with your client, so the next time they need a $7k makeover on their site, yours is the only bid they’ll consider… after all, you’re doing so much for them already.

So there are 5 ways you can leverage your web development relationship with your client into a bit of residual income.  It’s by no means an exhaustive list.  If you’ve got better channels for residual income or maybe just excellent suggestions for the resell-able or referr-able services listed above, share it with us in the comments.

Eight things you could do with monitoring checks on 1000 targets

With NodePing, you get checks on up to 1000 targets or services for one flat rate. NodePing’s 1000 service limit is designed to take the lid off of the kinds of limitations you might face with other service providers that charge more for adding checks or services. Once more checks don’t cost you more, what could you do with them? Every once in a while one of our customers has that moment where they realize how much they can do with NodePing that they couldn’t do when adding check targets raised the price. Here are eight things 1000 check targets can allow you to do that you might not do on other services.

  1. Monitor all your web sites and all basic services. OK, this one isn’t very creative, but it has to be said. If you are responsible for your business’s web sites then you need to know if they are down. Web sites that are down are not generating revenue, or if they are internal sites are not enabling your business to operate. If a site is worth having, then it is worth monitoring. This is the main reason people use monitoring in the first place. This goes beyond just web sites. If you are responsible to make sure that a service is available to customers or employees, you should monitor it so that you know immediately if it is unavailable, before someone complains.
  2. Our tongue-in-cheek tag line is “All your nodes are pinged by us,” but why not? With NodePing, now you can ping them all. If you don’t need notifications on all of them, just turn that off on a host by host basis, but you’ll have availability and uptime stats on everything.
  3. Monitor that a web page is showing the right information. This is called a web content check. Some web applications and content systems don’t return a proper 404 error, so to a normal HTTP check the page might appear to be up. A HTTP Content check makes sure the site is up by checking that it contains what you are expecting it to contain. It is often good to set the content to be checked as something that appears in all your pages, such as your copyright statement. This way if the text on the page changes during the normal course of business, your check will still pass.
  4. Monitor that the wrong text isn’t appearing on the page. Some web pages contain dynamic text. This is particularly the case for pages that show feeds, or your most recent news items. We’ve all gone to a site that should have a page with a list of articles or posts, but instead shows a database error or some kind of “No articles found” message. If that’s not what you want people to see, but you don’t know what text to check for because you don’t know what articles will appear, a check that makes sure the page does not contain specific text is the way to go.
  5. Along the same lines, since you have plenty of checks you might want more than one check on the same URL. If you need to watch for more than one error message, or check that multiple widgets or blocks on the page are populating correctly, why not check them all?
  6. Simple cron replacement. Many times web applications have a process that needs to run every so often, maybe every hour or every minute. These are often accessible by hitting a URL. This is often done by using curl or wget in a cron job, but it is easier to set up a check to hit the URL at the right interval. We use this to keep couchdb views fresh. Similarly, it can be used to replace Drupal’s cron job requirements.
  7. Check API’s and other HTTP interfaces. These often don’t get monitored, but they can be a key piece of your business. The HTTP Content check doesn’t care what kind of body the response has, and it will happily check for your text in JSON or XML as well as in HTML. You can monitor that a CouchDb server is saying “Welcome,” for example, or hit a URL that returns a reduced view and look for the value you expect in the results. The same idea applies to SOAP interfaces as well.
  8. Monitor other monitoring. Many systems have a status page that says how services on that host are doing. Frequently they’ll have an OK message, or an ERROR message will appear when things go wrong. HTTP Content checks can be used to watch these pages and send notifications if the wrong thing appears or does not appear on those pages. Both the “Contains” and “Does not contain” options for content checks are useful on this one.

There are many more things you could do with 1000 checks that you might not even consider doing with other services. We plan to add more check types to increase the utility of the service even more. What other things could you think of doing if you aren’t limited by artificial constraints imposed by services that charge by the target service or URL?

Monitoring Services Are Poised for a Shake Up

Server monitoring and website monitoring services cost too much and are overly complicated.

Over the past several months we have built and launched NodePing’s site and server monitoring service. Part of that process involved looking at the other companies in this market niche, and finding the opportunities for offering a service that fills a gap in what is currently being provided to customers. What we have found has confirmed our original reasons for starting NodePing.

There are a lot of companies offering site and server monitoring services. However, our experience as consumers of these services was that it was hard to find a provider that did what we needed at a reasonable price, and I think our experience is probably typical. Where’s the disconnect? We wanted a service that would allow us to watch twenty to thirty sites and services for a reasonable price. It is easy for a small to medium business to get to a couple of dozen services needing monitoring. Most companies have at least one or two web sites that need to be available all the time for their customers. Many also have two or three web sites used internally for collaboration and sharing or publishing information to employees (Intranets). Throw in a DNS server or two, a mail service, an accounting system, a key router or two, and you are quickly into double digits on the number of services that need to be checked.

IT departments used to run software like Nagios for this type of thing, and that is still a good option in many cases. Nagios provides a wider set of checks than a typical SaaS monitoring service, there are lots of specialized plugins available, and it is not all that difficult to write custom plugins. If you need specialized checks, a system like Nagios is probably the best bet. On the other hand, while Nagios is free software, running it is not free. It requires a server to run on. Typically you want monitoring to run on separate infrastructure from your normal servers, which often means leasing a server or using a VPS service. Doing this inexpensively typically runs $50-100 a month, and involves a non-trivial amount of technical expertise and work to setup, tune, and maintain. That’s not a huge amount of money, but it is not free.

External providers offer similar services. The majority of companies need HTTP, SMTP, and PING checks. These are the primary checks provided by the bulk of the monitoring as a service industry. These types of services don’t cost much to run. With today’s opportunities to build and deploy cloud based services in cost effective ways that scale well, the cost of these types of services should be fairly low. That’s not currently the case.

A quick search turns up a lot of companies offering these services. Many of them offer “free” or inexpensive services. “Free” monitoring is typically provided for one to five URLs, often with fifteen to thirty minute intervals. That is basically useless. If it is ok for a service to be down for 30 minutes without getting a notification, you probably don’t need monitoring. In my opinion, a price “plan” isn’t a serious offer unless they offer the service in intervals of five minutes or less at that price. Getting beyond that unhelpful “Free” level, many providers start charging by the URL or address you want to monitor. One company prominently advertises checks starting at $1, but again that’s one URL in thirty minute intervals, and it costs $11 for that URL check if you want to do check it every minute. Paying per check or per URL quickly gets expensive. It is not uncommon to find special price calculators on the sites of this kind of provider, which is itself a hint that the pricing is too complicated. At these prices, a fairly typical small to mid-sized company could easily find themselves spending hundreds of dollars a month on monitoring.

There are more competitive options out there. These companies typically cost $40-$60 for a reasonable number of addresses and services. These prices probably save you money compared to running monitoring yourself using something like Nagios. Plus, you don’t need to deal with setting up and maintaining the software. That’s a pretty good deal.

However, it still doesn’t need to cost that much. With modern hosting and technology, the cost per check and even per customer to run these types of services is very low. In fact, just about the only cost of running a service like this that is attributable to an individual account is the credit card processing. All the rest of the costs scale, and are spread in ways that actually decrease per account as you scale up. Unless they are just running very inefficient systems, the total overhead for the companies charging $40-$60 per month (not to mention the ones costing hundreds) should be less than $4 per customer. Of course, the companies advertising “Free” services are also spending dollars a click to get those accounts, and that easily becomes the biggest expense. Meanwhile, allowing their customers to add additional checks or URLs to an account costs the provider pennies. Pricing based on adding checks or URLs is a model completely detached from the economics of running the service.

Experience in running IT departments and talking to system administrators tells us that there are a lot of services that should be checked if best practices were followed that aren’t getting checked. Many companies that use external providers check their company’s primary site, but when adding checks means adding overhead costs (or just the work load), secondary and internal sites don’t get checked. This means that there are millions of services that should be monitored that aren’t getting monitored at all. Companies are just reacting to complaints when something goes down.

To us, this smelled like opportunity. It is not simple to set up a solid monitoring service. However, once the technology, infrastucture and processes are in place, it is a service that scales. The margin stays fairly stable even if you let customers use it as much as they need. This calls for a flat rate model.

Our biggest problem is that we have entered a market that is saturated by misinformation. Buyers assume that this type of service costs at least $40 for a reasonable level of monitoring, and often lots more. They expect to see low entry prices that don’t really meet anybody’s needs, followed by much higher prices for the real service. This becomes a marketing challenge. When shopping for these services, NodePing’s price of a flat $10 for monitoring sounds like one of the entry point bait ads. We say “$10 to monitor up to 1000 services in 1 minute intervals” and people ask “Yes, but what do we really get, and what’s it cost if we actually need to do real world monitoring?”

NodePing’s services really cost $10 a month. Period. There are no add-ons, no “X is available at additional cost”. We set 1000 services as the maximum because we don’t want to monitor IBM’s network (no offense to IBM intended). Our target is small to medium sized businesses, and we want them to monitor everything they want to monitor for one reasonable price. If this model works, maybe others will also move to flat rates. That’s great. We’d be happy to help make the monitoring world make more sense and be more cost effective for businesses. We think we have a solid technology stack and a great service, and we can do quite well even if other providers compete with us directly on price. Until then, there are few if any major providers that really provide the services that our customers need anywhere close to our price.

Monitoring services cost too much and are too complicated. We think this market is set for a change, similar to how the cloud has impacted other technology services. This shift will be a significant benefit to small and medium sized companies that need these services, and it is a fantastic opportunity to providers poised to provide the services the customers need at truly competitive scale and rates. NodePing has positioned itself to provide the services businesses need at a fantastic, flat-rate price.