Support for Multiple Public Status Pages
2017/10/11 Leave a comment
Our public status report is a critical part of keeping your customers informed of your site and service status—which after all is one of the points of monitoring. Our status pages are customizable to your company, and support a custom domain so you can display your status at status.yourdomain.com, or whatever is most applicable to your business.
We have had a public status page as one of our key features for some time. Now, we’re adding support for multiple status pages on one account. For instance, NodePing has a status report page for our websites at status.nodeping.com, and one specifically for our probe servers at probestatus.nodeping.com. Business and Provider accounts can optionally set up an SSL cert for their status pages (contact support for info how).
To create a new status report, just log into your account , and go to the “Account Settings” tab, then the “Reporting” subtab. Click “Add new status report” and add as many checks as you want to your new status report.
We hope you will find this feature just as useful as we do. We also have several more enhancements for public status pages coming soon. Let us know what you think at support@nodeping.com, by posting comments here, or by using our Contact Page.
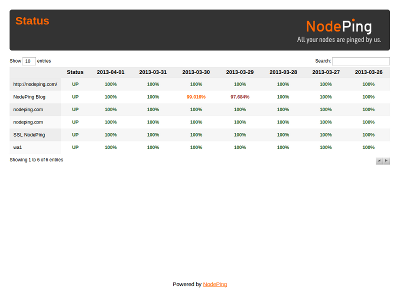 The status report allows you to select any of your active checks for listing on the status page. Any number of checks can be included. Just go in to the Reporting tab under Account Settings and select the checks you want to have displayed. The tab also shows the URL for your status report page.