Database Monitoring with NodePing

In our recent post ‘Beyond “Is It Up?” – Website Monitoring should be Comprehensive‘ we talked about how website monitoring should be wider than just measuring if a website responds to requests.  If you are responsible for website availability or performance you should of course be monitoring if the website responds in a timely manner, but you also should be monitoring status codes in the response, validating certificates and domain expiration, and DNS.  In today’s post I wanted to extend that discussion to another critical component of your infrastructure: monitoring database accessibility and performance.  Not only are databases a critical part of your web infrastructure, NodePing’s database monitoring can be a key element in your overall infrastructure monitoring that goes well beyond the web.

Monitoring Database Connectivity and Accessibility

As with any server monitoring, the first layer to consider is connectivity and accessibility.  Depending on your network infrastructure, this might mean some combination of PING, MTR, and PORT checks.  These check types can tell you if the database is accessible from places it should be, and make sure it remains inaccessible when it shouldn’t be.  In fact, it is a good idea to monitor your firewalls and routers with these check types.  At its most basic level, the PORT check tells us if your database servers are listening and responding on the expected ports.  The flip side of this is also important.  If your database should not be accessible from the Internet, running a check that monitors that can be just as important to make sure it stays that way. 

In testing connectivity, the PORT check can test just about any service.  For databases specifically, NodePing adds protocol aware monitoring for databases that respond to HTTP requests, as well as check types that understand the specifics of connecting to Redis, MySQL, PostgreSQL, and MongoDb databases.

Querying HTTP based databases with advanced HTTP check types

For databases with native HTTP support, using NodePing’s HTTP based check types can be really useful for monitoring the database performance, as well as monitoring specific responses.  For example, internally we have used our own monitoring to keep track of CouchDB databases for years.  This is useful for answering questions like 

  • Is the database responding in a reasonable time frame?
  • Is the database accessible using SSL/TLS, and is the certificate valid or about to expire?
  • Is the database listening and accessible to non-encrypted ports?  In our use case, this answer needs to be “No,” so NodePing’s capability to monitor that a port is not accessible is important here.
  • Are Couchdb views responding?  We keep some indexes that don’t get constant use warm with monitoring checks.
  • Are the actual values returned within expected ranges?  NodePing’s HTTP Parse check can make an HTTP request and then monitor specific fields within a JSON response to make sure it is within the expected range.  This is particularly useful in monitoring a Couch view that uses reduce.

Running Queries on MySQL, PostgreSQL, and MongoDb

NodePing has specialized check types that can monitor MySQL, PostgreSQL, and MongoDB specifically.  For these databases, NodePing’s monitoring can run a user-defined query and report on the response.  This allows you to run a custom query to track performance metrics, data counts, or set up alerts based on whether the responses are within a defined range.  If the expected response is a string, you can use regex to match the response to ensure it is what is expected.  These responses can be used to trigger notifications, graph values in your database, and store the data for future reference and analytics.

Security considerations for database monitoring

We already mentioned a few of the considerations around the security implications of database monitoring.  The database queries discussed above can use authentication where applicable.  For HTTP connections, as well as MySQL and PostgreSQL, the checks can be used to verify the encryption and certificates.  But a key element in monitoring databases is that in the vast majority of cases the databases should not be universally accessible.  NodePing’s AGENT based checks allow you to run these checks from your own networks, which means you get the full robust monitoring of NodePing’s checks, without opening your database ports to the outside world. In addition, our PUSH check type allows you to script database verification and push the results into NodePing for alerts and reporting.  This suite of check types and options together allow you to do robust monitoring for your databases without compromising your security.  In addition, we recommend that you use authentication to provide the monitoring with the least required access to do the necessary monitoring.

Monitoring Should be Comprehensive

From the outset NodePing has sought to provide website and server monitoring at a price point that allows you to run all the checks you need cost-effectively.  That’s because we believe that monitoring should be comprehensive.  You should be monitoring all of the components of your infrastructure in a way that when you are notified, you know immediately where a sysadmin response is needed.  Database monitoring is a critical component of this.  NodePing’s database monitoring can be a key part of your overall solution to ensure your services are all working as they should, and quickly tell you where the problem is in order to minimize disruptions.

Give it a try!  NodePing has a free, 15-day trial, so there is no risk to trying it out.  We think you’ll be impressed by how easy it is to get comprehensive monitoring in place, including for your databases, and how cost-effective and timesaving it can be as a part of your overall infrastructure management.

The NodePing API and PowerShell

At NodePing we interact with our own API quite a bit from the command line.  Most of that is from bash on Linux, because that’s where we live most of our lives.  But the API works well from just about any scripting environment.  Since our documentation examples all use curl with bash syntax, it seemed like it might be a good idea to also write up some examples of using other tools.  Here, as the first installment of that effort, is a handful of examples of using PowerShell with the NodePing API.

Full disclosure: PowerShell is not an environment we spend a lot of time working with.  There are likely ways to do some of this better.  We’ve tested the example calls in this post.  Hopefully it is enough to get you started if you work with PowerShell.

Basic GET Calls

Basic calls are quite simple to make using Invoke-RestMethod.  If you have the check ID, getting a check is quite easy:

Invoke-RestMethod ‘https://api.nodeping.com/api/1/checks/201205050153W2Q4C-OJ2HSIRF?token=[token]’

This returns a JSON object, which PowerShell handles easily.

_id : 201205050153W2Q4C-0J2HSIRF
description : This is the description, if the check has one.
public : False
customer_id : 201205050153W2Q4C
queue : nyI8JSL23W
interval : 1
created : 1427513104608
pro : nodeping.com
modified : 1510332098196
parameters : @{target=https://example.com/; follow=False; threshold=5; sens=2; invert=False; verify=false}
firstdown : 0
label : Keep me
runlocations : False
enable : active
uuid : bd3eha9o-z2m5-4qg2-9k8b-jqq0kiituyxz
state : 1
status : assigned
notifications : {}
type : HTTP
acctdisable : False
suspacct : False
dep : False

Note that “parameters” is another hash.  You can refer to the fields in the check as properties of the returned object, including properties that are hashes themselves.  So, for example, this will give you the check check threshold, which is part of “parameters”.

$check = Invoke-RestMethod ‘https://api.nodeping.com/api/1/checks/201205050153W2Q4C-0J2HSIRF?token=[token]’ ;
$check.parameters.threshold;

API Authentication

PowerShell doesn’t easily support basic authentication.  Since the NodePing API supports passing the token as a parameter, the easiest approach is to include it in the query string, as I did in the example above.  In most cases I prefer to pass it in the Body, as I’ll show in examples below.  If you’re working with a script its usually easiest to set a $token variable and use that throughout your script.  If you’re just sending a URL as I did in the simple GET calls above, actually putting in the query string works fine.

If you’re using the API in scripts that make several calls to the API, you might want a more reusable way to pass the token that keeps it out of your Body.  You can do this by manually building the headers.  That requires base64 encoding the credentials and then setting that using the -Headers argument. That looks something like this:

$hash = [Convert]::ToBase64String([Text.Encoding]::ASCII.GetBytes(("{0}:{1}" -f $token,"")))

Then set the -Header argument to @{Authorization=(“Basic {0}” -f $hash)}

Or, if you are doing this several times, you will probably want to set this to a variable you can reuse.

Some sites suggest that you create a credential object using ConvertTo-SecureString and Management.Automation.PSCredential, and pass that using the -Credential argument.  However, this won’t work with the NodePing API, since the -Credential option waits for the challenge to send the authorization header.  The API is stateless, and expects the header on each request.

Put and Post Calls

We recommend that you use JSON to set fields for our API in most environments.  However, PowerShell does not automatically handle sending the body as JSON.  For POST calls, this isn’t a big deal, and you can just POST the body as it is and Invoke-RestMethod sends the data as if it were a form.  PUT and DELETE calls don’t work that way.  For those, you have to convert to JSON, or include all of your parameters in a query string.

Creating a check looks like this:

Invoke-RestMethod 'https://api.nodeping.com/api/1/checks' -Method Post -Body @{ 
    label='test label' 
    type="HTTP"
    target="http://example.com"
    token=$token 
}

This call will return an object with the new check.  You can add any of the other fields listed in our documentation.

Updating a check is almost the same.  This can all be done on one line, but we’ll split it out here to make it easier to see.

$data = @{ label='a new label'; type="HTTP"; interval=5; token=$token } | ConvertTo-Json
Invoke-RestMethod 'https://api.nodeping.com/api/1/checks/201205050153W2Q4C-0J2HSIRF' -Method Put -Body $data

Note that since we’re updating a check, we need to include the check ID.  As with the Post call, the Put call returns the updated check object.

Working with Lists of Checks

Working with a list of checks is slightly trickier.  The call returns a JSON object with a list of checks using the ID as the key.  For PowerShell, this is a hash table of hashes.  So to list checks, you would do something like this:

Invoke-RestMethod 'https://api.nodeping.com/api/1/checks' -Body @{ token=$token } | %{ $_.PSOBJECT.Properties.value }

This is actually fairly handy, because you can fairly easily list a specific field from the response.  For example, this lists all of the targets from all of the checks on this account:

Invoke-RestMethod 'https://api.nodeping.com/api/1/checks' -Body @{ token=$token } | %{ $_.PSOBJECT.Properties.value.parameters.target }

You could do all sorts of things at this point.  For example, here’s a list of all checks that include “nodeping” somewhere in the check’s target:

Invoke-RestMethod 'https://api.nodeping.com/api/1/checks' -Method Get -Body @{ token=$token } | %{ foreach($value in $_.PSOBJECT.Properties.value){ if($value.parameters.target -like "*nodeping*"){ $value } } }

This is practical as a way to find a check with a specific target up to a few thousand checks.

Getting Results

Applying the same principles should let you do just about anything with the NodePing API.  Applying the same pattern to a results call, for example:

Invoke-RestMethod 'https://api.nodeping.com/api/1/results/201205050153W2Q4C-0J2HSIRF' -Method Get -Body @{ token=$token; limit=2; clean=1 }

Note that you’ll want to always include the “clean” parameter for results.  The unclean response takes more parsing.

The options available for results calls are documented here:
https://nodeping.com/docs-api-results.html

Profit!

That’s the basics of using PowerShell to interact with the NodePing API.  With the API you can add checks, remove checks, get your results and uptime, manage contacts and notifications, and add and manage subaccounts.  Our customers use the API both for programmed integrations, and from the command line using quick scripts like the ones I demonstrated here to make quick changes to several (or lots) of checks at once.

If you’re doing interesting things with PowerShell and the NodePing API, we’d like to hear about it!  Please email support and let us know.  That’s also a great place to ask us questions.  We’re happy to help people interact with our service.

Notification Escalations on NodePing

Most systems run smoothly most of the time.  Servers keep running.  Web sites serve pages and deliver data from backend databases.  DNS servers respond to queries with hardly any delay at all.  Email flows smoothly.

Emergency_light_with_grillIt’s that tiny percent of the time that it doesn’t work that way that causes the heartburn.  A server that has been running just fine for months suddenly hiccups.  But even when that happens, it’s usually a hiccup.  The person who is the first line of responsibility for that service needs to know right away.  They jump on it, clear the problem, and things go back to humming like normal.  You need fast and reliable monitoring to help keep these interruptions to service short.  A lot of times, the service is back to normal before most people realize there was an issue.  These incidents likely go in a report, but the rest of the team doesn’t need to get involved.  Its dealt with, duly noted, and life goes on.

Then there are the times that something goes really wrong.  The first line is working on it, but the server isn’t going to be back up in a minute or two.  Or the first line person is not available.  Maybe he’s in accounting trying to sort out his paperwork for credit card expenses for last month.  Someone else needs to know that things are down.

Sometimes these situations turn into real disasters.  The website is down.  Upper management is going to be calling, wondering who’s spilling revenue out on the server room floor.  The manager getting that call wants to know about it before the phone rings with that call.

Most monitoring systems use escalating notifications to handle these situations.  If a system is down, the first line person should be notified immediately.  If it’s down for a few minutes, the people who back him up need to be brought in.  If it’s down longer than that, systems management will want to get a heads up.

NodePing uses the notification delay feature to provide notification escalations.  A delay can be set on each notification contact for each check.  The NodePing notification delay feature notes that a check set with a delayed notification has gone down.  After the delay interval has been reached, if the check is still “down” we send the notification to that contact.

Set up the first line systems with no delay, so they’ll get notified when the system goes down right away.  If the service hasn’t recovered in a few minutes, send a notification to the systems group using a contact group.  Then, if the service hasn’t recovered in 10 minutes (or whatever the tolerance for the service being down is for this service in your organization), notify the systems management.

The notification delay feature can be used for other things besides notifications.  Sometimes services have a higher tolerance for transient interruptions.  You can use the delay to mean “if this service is down shorter than 3 minutes, I don’t need to be notified.”  This is useful, for example, for services in remote locations where Internet connectivity can have brief interruptions.  But our most common request for using the delays are for notification escalations.


Support for Multiple Public Status Pages

Our public status report is a critical part of keeping your customers informed of your site and service status—which after all is one of the points of monitoring. Our status pages are customizable to your company, and support a custom domain so you can display your status at status.yourdomain.com, or whatever is most applicable to your business.

We have had a public status page as one of our key features for some time.  Now, we’re adding support for multiple status pages on one account. For instance, NodePing has a status report page for our websites at status.nodeping.com, and one specifically for our probe servers at probestatus.nodeping.com.  Business and Provider accounts can optionally set up an SSL cert for their status pages (contact support for info how).

To create a new status report, just log into your account , and go to the “Account Settings” tab, then the “Reporting” subtab. Click “Add new status report” and add as many checks as you want to your new status report.  

We hope you will find this feature just as useful as we do.  We also have several more enhancements for public status pages coming soon.  Let us know what you think at support@nodeping.com, by posting comments here, or by using our Contact Page.

Disabling SSLv3 on NodePing website and API

In response to the recently announced vulnerability in SSLv3, we are disabling this version on our web site today, and for our API tomorrow. We do not anticipate that this will negatively impact any of our users. However, if you use our API with an older implementation of a library or scripting language, you may want to check to make sure that it supports newer protocols.

Monitoring Memory Usage in Node Applications

I recently started a new node.js project that stored a good bit of data in memory, and talked to clients over web sockets as well as providing a REST interface. The combination of components meant there were several spots that I wanted to monitor.

For the WebSockets, I hooked up NodePing’s WebSocket check. In this case, I didn’t need it to pass any data, just connect and make sure the WebSocket interface was accessible. This was a quick win, and in seconds I was monitoring the WebSockets interface of my new app.

One of our concerns with this particular application was how much memory it would use over time, since it retains quite a bit of data in memory for as long as the server is running. I was curious about how much memory it would end up using in real use. I was also concerned about any memory leaks, both from the data caching and the use of buffers as the system interacted with WebSockets clients. This called for monitoring memory usage over time and getting notifications if it passed certain thresholds.

To accomplish this, I used NodePing’s HTTP Parse check. In my node app, I created a route in the REST interface that would return various statistics, including record counts in the cache and a few other things I was curious about. The key piece for monitoring purposes, though, was the output from the node.js process.memoryUsage() call. This gives me a nice JSON object with rss, heapTotal, and heapUsed numbers. This was in combination with some other stats I wanted to capture, and the output looked something like this:

 {
  "server": {
    "osuptime": 22734099.6647312,
    "loadavg": [
      0.17041015625,
      0.09814453125,
      0.12451171875
    ],
    "freemem": 1883095040,
    "processmem": {
      "rss": 77959168,
      "heapTotal": 63371520,
      "heapUsed": 30490000
    }
  }
}

Next I added an HTTP Parse check in NodePing, and added the rss and heapUsed fields to the check. For the check setup, we use JSONPath syntax, so the full fields looked like this:
server.processmem.rss
server.processmem.heapUsed

At first I was a little startled by the results of this. The rss figure is consistently a good bit higher than the heapUsed number, and it climbs slowly over time. At first glance this looks like the system has a memory leak. However, it turns out this is normal for node.js applications. Node manages the memory used internally, and the rss figure shows what’s been allocated at some point and is still reserved, but not what’s actually in use. The heapUsed figure, on the other hand, does reflect Node’s periodic garbage collection.

I found the HTTP Parse check to be perfect for watching memory usage and checking for a memory leak in my Node application. The key was capturing the heapUsed as reported by Node. In my case I had the check grab this information once a minute, and I quickly had a handy chart showing the total memory usage of my application over time. As a result, trends become quickly apparent and I can see how my memory usage grows and shrinks as Node manages its memory usage.

Since I was hitting the REST interface of my application once a minute to collect the memory information, this had the side benefit of notifying me if the REST interface ever goes down. If I wanted to chart the REST interface’s response time, I’d add a separate HTTP check.

At NodePing, a lot of what we’ve built originated in our own experiences building and supporting Internet-based services. This is another example of how we have used our own monitoring systems internally to help us build and maintain our own systems.  If you  and haven’t tried out NodePing’s monitoring, check out our 15-day free trial.

Public Status Report Update

NodePing’s public status report feature allows you to create an uptime report for your sites or services in your own domain. It’s a popular part of our website and server monitoring service, and is available on all NodePing accounts. Today we added a couple of (hopefully very useful) enhancements to the public status reports.

The report now has a column on the right side that shows the uptime for each service over the past 30 days. It also allows you to display a column to show the check type, which can be turned on and off in the report’s configuration page. Plus, we’ve also tweaked the filtering on the title field, which has opened it up to a wider degree of customization. For example, you can include image tags and style tags in this field, which allows you to add your logo, as well as having significant control over the overall look of the report.

The report already gave you the ability to set which checks should appear on the report, and to set a custom URL for the report (so, for example, you could have it on the status subdomain of your own domain, so the URL would be status.example.com). And if you have public reports turned on for individual checks, those reports will automatically be linked from the status report.

We hope that these enhancements, on top of the features we already had for the status report, will make this report very useful to all of our customers. We put a lot of emphasis on feedback from our users, so please let us know what other features would help you make the most of our monitoring service.

If you run web sites or other Internet services and haven’t tried out our monitoring service, give us a try with out 15 day free trial.

Public status reports updated

We announced the initial release of our public status pages for our web site and server monitoring service a couple of weeks ago. These pages allow you to have a public status page for all of your servers and websites in one place. Since then, we’ve worked to add some additional enhancements that we think will be particularly useful.

First, we’ve added custom domains. This allows you to set up a URL such as https://status.example.com as your public status page. Just add a cname record to your DNS to point the domain to nodeping.com, and add the domain or subdomain to the report settings in your NodePing account (under Account Settings -> Reporting), and the custom URL will be available within 30 seconds or so. Once you have a custom domain set up, all of your public reports are available on that domain.

We’ve also added links to reports on individual check results. Any checks for which you have enabled public reports will include a link on the status page to go to the individual report. At the same time, we tweaked the individual results report so that the long list of results only shows if you click on the “Show Details” button. We got some feedback that the whole list is a little overwhelming, so we’ve made the information still available but not shown by default.

Finally, we’ve made a few cosmetic tweaks to the reports and to the reports settings page.

We have a number of additional features and enhancements we’re planning to add to these reports still, but we hope what we’ve done so far is already useful to everybody. As always, feedback and suggestions are welcome. Let us know what you think at support@nodeping.com, by posting comments here, or by using our Contact Page.

Public Status Pages

One of the frequent requests we get is for a public status page that lists the status of several server monitoring checks in one place. There is a lot to this particular feature, but we’re pleased to announce that the first version of this feature is now available on NodePing.

NodePing Status Report
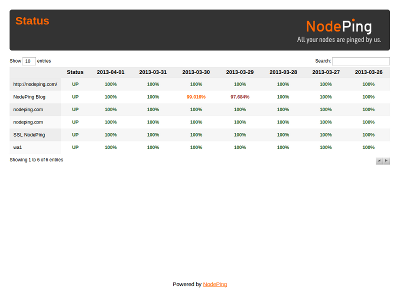
The status report allows you to select any of your active checks for listing on the status page. Any number of checks can be included. Just go in to the Reporting tab under Account Settings and select the checks you want to have displayed. The tab also shows the URL for your status report page.

The report has a “title” field, which is displayed at the top of the page. This field supports HTML, so you can add tags to style the look of the top of the page. That includes using an img tag to show your logo or other branding type information at the top of the page. For examples, you can look at https://nodeping.com/reports/status/MTSL1PQUZC and https://nodeping.com/reports/status/P9H0LI94W7. Script tags and other cross site scripting will be filtered. Provider accounts have additional control over the look of the page using the site branding features.

We didn’t want to just start publishing information without allowing people to opt-in to this featuer, so by default this report is not enabled. Enabling it is just a few clicks.

There are a number of additional features that we plan to add to this report, including more customization, links to individual check result pages, and custom URLs. In the meantime, feedback and suggestions are always welcome at support@nodeping.com.

Minor API enhancements added today

We have a couple of updates to our API.

You can obtain the current status of your checks using /api/1/results/current. This returns a list of checks that currently have an “event,” which means that the check is currently disabled or is listed as “down.” The information returned will include a timestamp when the event started. Checks not listed in the results for this call are currently “up.”

We’re also adding a couple of convenience tweaks. When you are getting a list of checks, you can add a “current” parameter in order to have any current events added to the check information. This basically mixes the information from the “current” call mentioned above in with the list of checks.

Additionally, when you are getting a single check, you can add a “lastresult” parameter to the request and get the most recent result for that check along with the check information.

All three of these changes are included in our API Reference documenation. Hopefully these minor enhancements will be of help. Feedback is welcome here or at support@nodeping.com.