I recently started a new node.js project that stored a good bit of data in memory, and talked to clients over web sockets as well as providing a REST interface. The combination of components meant there were several spots that I wanted to monitor.
For the WebSockets, I hooked up NodePing’s WebSocket check. In this case, I didn’t need it to pass any data, just connect and make sure the WebSocket interface was accessible. This was a quick win, and in seconds I was monitoring the WebSockets interface of my new app.
One of our concerns with this particular application was how much memory it would use over time, since it retains quite a bit of data in memory for as long as the server is running. I was curious about how much memory it would end up using in real use. I was also concerned about any memory leaks, both from the data caching and the use of buffers as the system interacted with WebSockets clients. This called for monitoring memory usage over time and getting notifications if it passed certain thresholds.
To accomplish this, I used NodePing’s HTTP Parse check. In my node app, I created a route in the REST interface that would return various statistics, including record counts in the cache and a few other things I was curious about. The key piece for monitoring purposes, though, was the output from the node.js process.memoryUsage() call. This gives me a nice JSON object with rss, heapTotal, and heapUsed numbers. This was in combination with some other stats I wanted to capture, and the output looked something like this:
 {
  "server": {
    "osuptime": 22734099.6647312,
    "loadavg": [
      0.17041015625,
      0.09814453125,
      0.12451171875
    ],
    "freemem": 1883095040,
    "processmem": {
      "rss": 77959168,
      "heapTotal": 63371520,
      "heapUsed": 30490000
    }
  }
}
Next I added an HTTP Parse check in NodePing, and added the rss and heapUsed fields to the check. For the check setup, we use JSONPath syntax, so the full fields looked like this:
server.processmem.rss
server.processmem.heapUsed
At first I was a little startled by the results of this. The rss figure is consistently a good bit higher than the heapUsed number, and it climbs slowly over time. At first glance this looks like the system has a memory leak. However, it turns out this is normal for node.js applications. Node manages the memory used internally, and the rss figure shows what’s been allocated at some point and is still reserved, but not what’s actually in use. The heapUsed figure, on the other hand, does reflect Node’s periodic garbage collection.
I found the HTTP Parse check to be perfect for watching memory usage and checking for a memory leak in my Node application. The key was capturing the heapUsed as reported by Node. In my case I had the check grab this information once a minute, and I quickly had a handy chart showing the total memory usage of my application over time. As a result, trends become quickly apparent and I can see how my memory usage grows and shrinks as Node manages its memory usage.
Since I was hitting the REST interface of my application once a minute to collect the memory information, this had the side benefit of notifying me if the REST interface ever goes down. If I wanted to chart the REST interface’s response time, I’d add a separate HTTP check.
At NodePing, a lot of what we’ve built originated in our own experiences building and supporting Internet-based services. This is another example of how we have used our own monitoring systems internally to help us build and maintain our own systems. If you and haven’t tried out NodePing’s monitoring, check out our 15-day free trial.
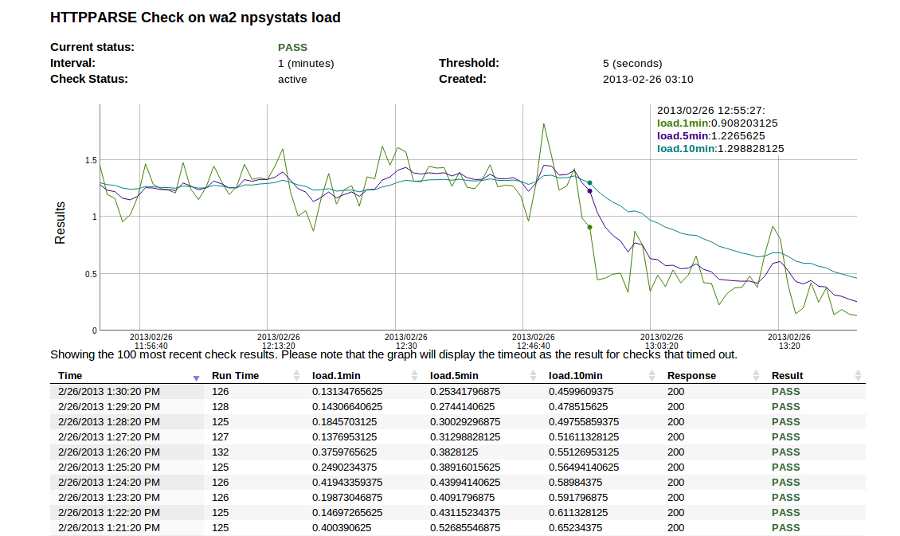 Our use of this check at NodePing is to monitor server health. As you can imagine, running a service like NodePing means we have a number of servers all over the place. We use this check to monitor server load, free memory and disk space on a number of our servers.