Monitoring the Server Room with NodePing – Part 1
2023/08/08 Leave a comment
Monitoring services inside the server room is pretty easy with NodePing. I’m going to show you how I can keep an eye on my server room and its services using NodePing PUSH and AGENT checks. In this scenario, the room only contains network devices, so I chose to stand up a Raspberry Pi. It will also let me add temperature and humidity sensors in addition to monitoring stuff inside the firewall.
NodePing offers two different check types to allow me to do on-premise system, sensor, and network monitoring: PUSH and AGENT checks.
PUSH checks allow me to send heartbeats from any server to NodePing. I can also use the metric tracking to do things like monitor load, disk space, memory usage, and more. Basically any numeric value I can read or generate on a box can be submitted, tracked, and trigger notifications.
NodePing AGENT checks allow me to configure NodePing probe functionality, installed and maintained by me and available only to my NodePing account. I can use my AGENTs to run other NodePing checks from anywhere, even inside my private network, without needing to open up any firewall ports.
The PUSH and AGENT checks can run on a wide variety of hardware. In this blog post, I would like to show you how I configure NodePing on-premise monitoring tools to work on a Raspberry Pi.

Setting Up
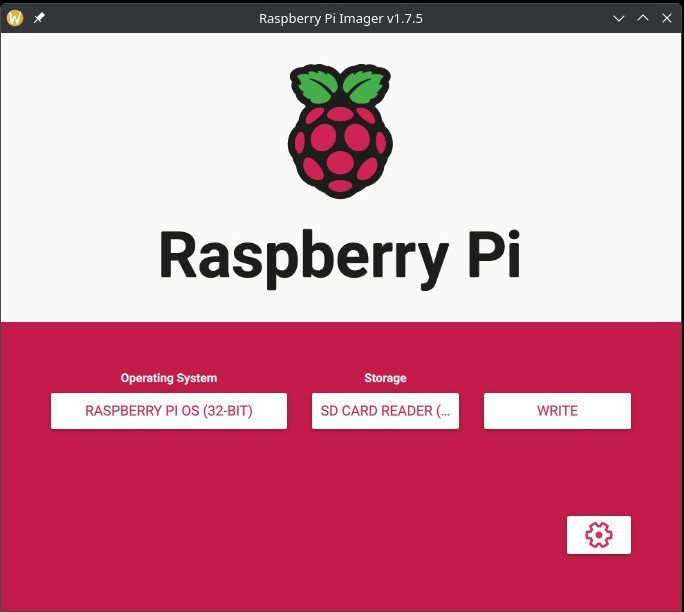
To get started with setting up the Raspberry Pi, I use the Raspberry Pi Imager to configure an appropriate version of RaspberryOS. I can use either the 32-bit or 64-bit options. Watch this quick video from Raspberry Pi on how to use their installer. The Imager can be obtained from their website. Below, I chose to use the default, and very popular, Raspberry Pi OS 32-bit. You can also select the 64-bit option as well as the Lite versions which are designed for headless installations if you don’t need a desktop environment. NodePing PUSH and AGENT checks work with all the different flavors of Raspberry Pi OS.
I intend on using this Pi in a headless configuration, without a keyboard or monitor always connected, so I go into the “Advanced Options” page in the imager and enable SSH. I’ll also need to configure a user, password, and necessary networking. It will need internet access either via wifi or ethernet to send check results to NodePing. I’m going to use one of the Lite versions in this case to reduce the amount of extra software that gets installed.

Once the microSD card is imaged, I insert it into my Pi and fire it up… waiting for it to boot. I’m able to SSH in! Good start.

From here, I do some further SSH hardening and require the user I configured to have the password entered when I do any sudo commands.
Additionally, I update the packages on my Pi.
$ sudo apt update
$ sudo apt upgrade
Installing the PUSH Clients
PUSH checks can submit any numeric metrics to NodePing using an HTTP POST, and be used to trigger notifications of the PUSH check. The PUSH payload schema is discussed in the PUSH check documentation. I can also use one of the pre-defined clients available on GitHub. Currently, NodePing provides PUSH clients written in POSIX shell, Python, and Powershell. The POSIX shell scripts and Python scripts will work on the Raspberry Pi. If I want to use a different programming language to create my own client I might want to use the existing code as a reference.
I’m going to go with the POSIX client. To get the PUSH clients code, I can visit the GitHub page to download a zip file or I can use git to fetch the code directly using the following command:
$ git clone https://github.com/NodePing/PUSH_Clients.gitFrom here, I can either use the clients from the directory that was cloned, or make a copy of the individual client elsewhere. A convention I tend to follow is to create a folder named something like “pi_push_metrics_202306261808OGK26-JEZ6ENNW” where name is the label of the PUSH check in NodePing, and the check ID that is generated when you create that check in the NodePing web interface.
I created those folders using the command:
$ mkdir -p push-clients/pi_push_metrics_2023-06261809OGK26-JEZ6ENNW

You can call your folder whatever you want. I use this so I can easily find the right PUSH check in NodePing that corresponds to this PUSH client.
Configuring a PUSH Check
Now I’m going to copy the POSIX client from the git clone I made into the new folder I created above.

Installation instructions are available for each of the client types. For now, I will show you a quick demo of how to configure a PUSH client that will monitor free memory, and 1 and 5 minute load averages. I configured my check like so in the NodePing web interface:
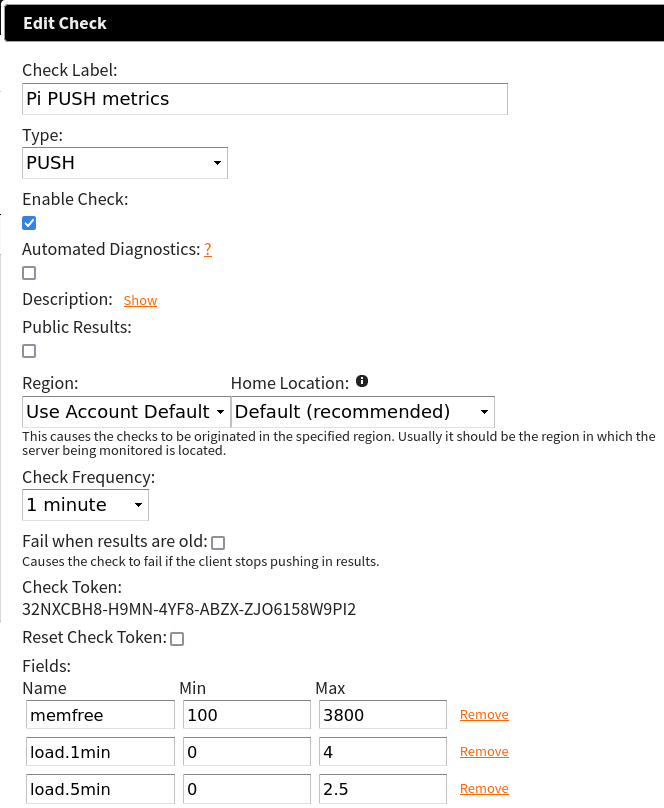
This check will pass so long as the free memory is greater than 100MB and less than 3800MB, 1 min load is between 0 and 4, and 5 min load is between 0 and 2.5. This will help me keep tabs on when my system load is too high, and if my Pi is using more or less memory than expected. For the client on the Pi, I am interested in a few files:
- NodePingPUSH.sh
- moduleconfig
- The modules directory
I have to ensure NodePingPUSH.sh and the other .sh files are executable by this system user. For the moduleconfig file I only want to run the memfree and load module so I simply add those in the moduleconfig file.

The contents of the file are only the 2 lines “load” and “memfree”.
For the NodePingPUSH.sh file, I need to add my check ID and its checktoken. These are found in the check drawer.
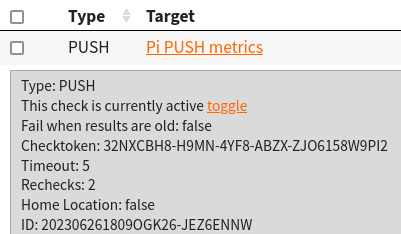

The only variables needing editing are CHECK_ID, and CHECK_TOKEN.
After configuring those files I will run:
$ sh NodePingPUSH.sh -debugThis will let me see the data that would be sent to NodePing without actually sending it. This is just for testing and is a good way to make sure I edited those files correctly without impacting any uptime stats for the check in NodePing.
Lastly, I need to set up cron to run my PUSH client on a regular interval. I want this one to run every minute, so the cron line will look like the one below. To edit my cron tab, I run crontab -e and add the following entry:
* * * * * /bin/sh /home/pi/push-clients/pi_push_metrics_202306261809OGK26-JEZ6ENNW/NodePingPUSH.sh -lThe -l at the end of that line will make the script log to a NodePingPUSH.log file in that same directory. You can modify the logfilepath variable in NodePingPUSH.sh if you want to have your logs go to a different folder.
NodePing AGENT
PUSH checks are great for pushing arbitrary metrics into NodePing. However, if I want to run one of our standard check types in my network, without creating ingress holes in my firewall, NodePing AGENT checks are the way to go. Once the AGENT software is installed, I’ll be able to run checks directly on this Pi.
Installing NodeJS
To setup the AGENT, I need NodeJS and npm installed. Raspberry Pi OS makes this simple with a single command on the Pi:
$ sudo apt install nodejs npmWith those pieces of software installed, I can clone the AGENT software git repo to get that code. The instructions can always be found in the GitHub repository, but for now, here’s the short version of the commands I ran as an example:
$ git clone https://github.com/NodePing/NodePing_Agent.git
$ cd NodePing_Agent
$ npm install
$ node NodePingAgent.js install 202306261809OGK26-1QFZPD19 31PF34KZ-JQ4S-43FP-8L6J-20Q46NFRPT07
The Check ID and Checktoken in the forth command example above are used to tie this instance of the AGENT running on my Pi to the AGENT check I created in NodePing. They can be found with the check information on the NodePing site:
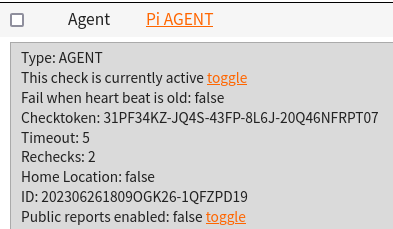
The node NodePingAgent.js install command will set up the AGENT to run, and at this point I can now create checks on NodePing and assigned them to run on this AGENT. To do that, when I create a check in NodePing, in the “Region” dropdown, I select the name of the AGENT I made. When that check starts to run, I should begin to see it is being run from my AGENT, not the normal NodePing probes.
Here’s an example where I’m pinging an interval server, using the private IP address, from the AGENT on my Pi.

Note that the Region is set to the label we gave to the AGENT check. Now with the AGENT running, I can monitor anything I choose from this Pi, whether the servers are internal or external.
Diagnostics
I want to take advantage of NodePing’s Automated and On-demand Diagnostics so I want to start the Diagnostics Client on my Pi as well using the following command:
node DiagnosticsClient.js >>log/DiagnosticsClient.log 2>&1 &The Diagnostics Client will allow NodePing to get MTRs, DNS, and other diagnostics to send me when my checks assigned there fail. It makes troubleshooting so much faster and easier.
This is Only the Beginning
Now I have a Raspberry Pi all ready to have NodePing collect a wide variety of metrics with my PUSH check and run as a custom NodePing probe with my AGENT check. I can use them to do all sorts of cool things.
In Part 2, I’ll add some hardware sensors to this Pi to measure temperature and humidity of my rack so alerts can be sent if either goes outside of a safe range. Fun stuff coming.
If you don’t yet have a NodePing account, please sign up for our free, 15-day trial.
