Monitoring Cron Jobs
2024/01/02 Leave a comment
NodePing makes monitoring your cron jobs easy with our PUSH checks. Each time your server runs a cron job, you can also have that cron job send results to NodePing to track successes and failures. Ensuring cron jobs are running properly is crucial to reliable operations. It is good to know if the cron jobs on your servers are running as you would expect, and receive alerts when they aren’t.
PUSH checks rely on basic HTTP POST requests to NodePing, which lets you submit data to give you insights into your systems. This method provides a lot of flexibility, since PUSH checks have the option to track numeric values.
Getting Started
To get started, I need to think about the cron jobs that are important to me so I can decide which cron jobs I want to monitor. Most commonly, I like to submit results with backups that I automate. I have a variety of options with how I can integrate my cron jobs for backups with NodePing PUSH monitors. For example:
- Insert the heartbeat into a script
- Use NodePing’s premade PUSH clients
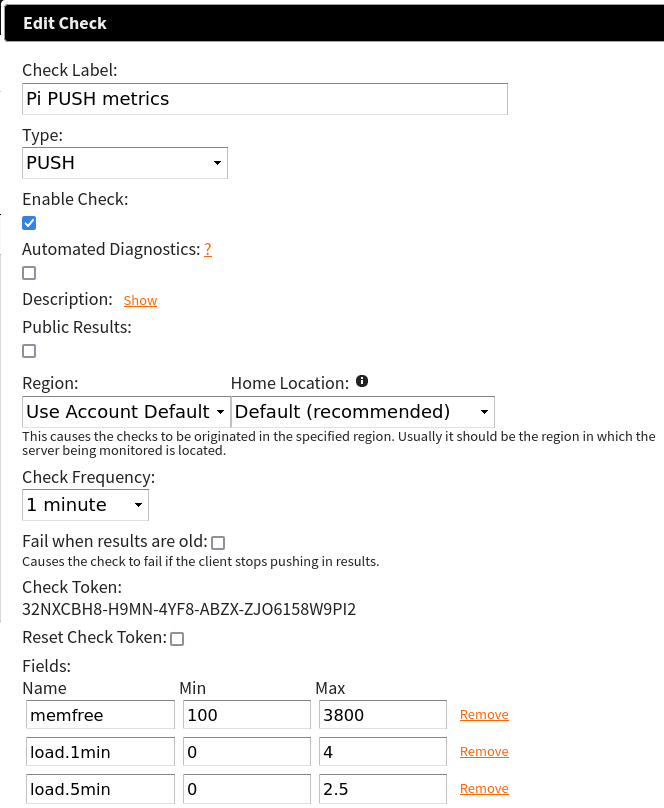
First, I’m going to create the check for my cron job monitor. I set a label that is easy for me to recognize, set the check type to PUSH. I have a single field I will call “backups” with min/max values of 0 and I also set the check frequency to one day, since this is a daily backup. I set my min/max values to 0 since my backup program returns an exit code of 0 on successful backup, and anything else is some sort of failure. NodePing will see the 0 and mark the check as passing, or if my backup program returns something other than 0, NodePing will mark the check as failing and send me notifications.

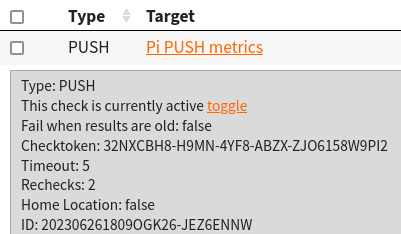
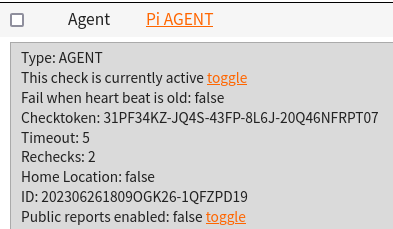
After creating that check, I open the check drawer so I can see my ID for the check and Checktoken. I will be using this information in my cron job.

Insert the Heartbeat Into a Script
My first option is that I can add submitting results to an already existing script. I use a program such as curl, netcat, wget, or openssl to do my HTTP POST. I can either insert the one liner at the end of my script and have it POST the same data every time, or, if the job fails, I can write my script to submit a pass or fail value, which I am doing in my backup example using ‘curl’. Below is a snippet of my backup script called do_backup.sh:
#!/usr/bin/env sh

# do backup
...

# Use backup tool's exit codes to decide success/failure
complete=$(echo $?)

curl -X POST -H "Content-Type: application/json" --data "{\"data\":{\"backups\":$complete}}" 'https://push.nodeping.com/v1?id=202306261809OGK26-3IQZJE0H&checktoken=OZS4N4G2-7A6U-4N86-8PV0-067F25B7TFHO'
In my curl command, I submitted the $complete variable’s value to NodePing. When I submit the value 0, the check is marked as passing by NodePing. However, if my backup utility exited with a code of 1, curl would submit that 1 to the NodePing PUSH check, and it would be marked as failing since I configured the check to pass only when the value is 0. This way, I will get a notification right away when a cron monitor fails or starts passes again. My cron job for my backup script runs every day at 1am:
0 1 * * * /bin/sh /usr/local/bin/do_backup.shIf you do not wish to use curl, you can use something like netcat, wget, or openssl:
With netcat-openbsd
BODY=”{\”data\”:{\”backups\”:$complete}}”
BODY_LEN=$(echo -n “$BODY” | wc -c)
echo -ne “POST /v1?id=202306261809OGK26-3IQZJE0H&checktoken=OZS4N4G2-7A6U-4N86-8PV0-067F25B7TFHO HTTP/1.1\r\nHost: push.nodeping.com\r\nContent-Type: application/json\r\nContent-Length: ${BODY_LEN}\r\n\r\n${BODY}” | nc -c push.nodeping.com 443
With openssl
BODY="{\"data\":{\"backups\":$complete}}"
BODY_LEN=$(echo -n "$BODY" | wc -c)

echo -ne "POST /v1?id=202306261809OGK26-3IQZJE0H&checktoken=OZS4N4G2-7A6U-4N86-8PV0-067F25B7TFHO HTTP/1.1\r\nHost: push.nodeping.com\r\nContent-Type: application/json\r\nContent-Length: ${BODY_LEN}\r\n\r\n${BODY}" | openssl s_client -connect push.nodeping.com:443
And with wget
wget -q -O- --post-data "{\"data\": {\"backups\":$complete}}" 'https://push.nodeping.com/v1?id=202306261809OGK26-3IQZJE0H&checktoken=OZS4N4G2-7A6U-4N86-8PV0-067F25B7TFHO'NodePing’s Premade PUSH Clients
On GitHub, NodePing provides a repository with premade clients and modules to get started. NodePing currently provides POSIX shell, Python, and PowerShell client scripts. The premade client gives me the option to create my own module and export the data without having to worry about how to write the HTTP POST part. This means I can submit results, like above, by modifying an existing script to work as a PUSH module. I will create a module with the POSIX client, and modify my script to work with the client.
Configuring the Client
I visited the GitHub page to download a zip file or I can use git to fetch the code directly using the following command:
$ git clone https://github.com/NodePing/PUSH_Clients.gitI then made a copy of the POSIX client. A convention I tend to follow is to create a folder named something like “backup_cron_job_202306261809OGK26-3IQZJE0H” where the name is the label of the PUSH check in NodePing and the check ID that is generated when the check is created.
I created the folders and copied the contents of the POSIX client with these commands:
$ mkdir -p push_clients/backup_cron_job_202306261809OGK26-3IQZJE0H
$ cd push_clients/backup_cron_job_202306261809OGK26-3IQZJE0H
$ cp -r ~/PUSH_Clients/POSIX/NodePingPUSHClient/* ./
The contents are now in the backup_cron_job folder. In the modules folder I created a folder and file called “backups”
~/../backup_cron_job_202306261809OGK26-3IQZJE0H $ mkdir modules/backups
~/../backup_cron_job_202306261809OGK26-3IQZJE0H $ touch modules/backups/backups.sh
The script would contain this snippet:
#!/usr/bin/env sh

# do backup
...

# Use backup tool's exit codes to decide success/failure
complete=$(echo $?)

echo "{\"backups\":$complete}"
The client will handle submitting this result for you. In the moduleconfig file, I removed the default contents and added backups to the file

I added my checkid and checktoken to NodePingPUSH.sh file

Lastly, I made the NodePingPUSH.sh script and my backups/backups.sh script executable. When I run the NodePingPUSH.sh script, it will run my backup, then submit a success or failure to NodePing. After making sure it worked right, I added the client to my crontab to run my backup at 1am, just as before, but using the PUSH client
0 1 * * * /bin/sh /home/backupuser/push_clients/backup_cron_job_202306261809OGK26-3IQZJE0H/NodePingPUSH.sh -lI added the -l to the end of my cron job to let the client log the successes and failures locally as well.
Conclusion
There is a lot of flexibility with NodePing’s PUSH checks that allows me to monitor my cron jobs. I showed you how I can insert an HTTP POST request into my existing scripts that I run via cron, or I can use the NodePing PUSH clients (or write my own in another language if I chose). Cron job monitoring is possible with any language too, and is not limited to shell scripts. PUSH checks are a very versatile tool NodePing offers, and it can go far beyond monitoring cron jobs.
If you don’t yet have a NodePing account, feel free to try out our 15-day, free trial and get started, having the assurance that your cron jobs are running, and get notified when they are not.