Webhooks for Business Plan Customers

At NodePing we are constantly striving to provide the best server monitoring service at absolutely the best price we can. Our goal is to be as useful as we can to meet your day to day monitoring needs for both web and server monitoring, at a price that removes all barriers for best practice monitoring for every service, everywhere.

In line with that goal, today we are changing the Business plan to add unlimited webhook notifications. Previously those were only available in the Provider plan.

Webhooks allow you to trigger actions on other sites based on events from NodePing’s monitoring system. This allows you to automate actions on your servers when a web site goes up or down. Common uses include changing DNS settings when a server goes offline and restarting a database when it fails.

Our hope is that including webhooks in the Business plan will make NodePing’s most popular plan even more useful for businesses the world over. A lot of what we do is based on feedback, so please continue to let us know how we can continue to make our service fit your needs even better.

HTTP Parse Check – Monitor Anything!

Most of the checks that we have released for NodePing to date have monitored specific Internet-based services. These are very useful, and they are the bread and butter of traditional web site and server monitoring services. Today we’re really excited to announce the release of our “Monitor Anything” check. You can use it to monitor… well, just about about anything.

The new check is the HTTP Parse check. It connects to a remote HTTP service and parses the response for specific fields and values. The values are then stored in the check results for reports. If any of the values are outside of your configured ranges, it triggers a notification via email, SMS, twitter, voice call, or webhook.

The HTTP Parse check can look for named fields in text or a JSON response. For example, if the check is configured to look for a field named “llamas” and the response contains llamas: 34 then the system will store 34 as the value, which will be displayed on reports and charts.

Similarly, the response could be in JSON format. For example, the JSON could be something like this: {"animals": {llamas": 34}} Configuring the check to look for animals.llamas will store 34 in the check results. The check can handle multiple fields, as long as they are all accessible from one request to a URL, and it can pull values from the middle of a larger response.

What could this check be used for? Anything that is accessible by an HTTP request that returns a field with a numeric value. Since it is parsing the response for the field name and value, it can be embedded in other data. This means that any JSON API or data service on the Internet is potentially a target for this.

Sample Server Load OutputOur use of this check at NodePing is to monitor server health. As you can imagine, running a service like NodePing means we have a number of servers all over the place. We use this check to monitor server load, free memory and disk space on a number of our servers.

There are many ways to generate the system information from a host so it can be used for this check. Some of the ones we’ve tried include Linfo and phpSysInfo. We wanted a similar tool written in Node.js, so we wrote npsystats, which is what we now use for our systems. We’ll have more to say about npsystats in the near future. There are a number of other similar tools out there, such as Ohai in Ruby. The HTTP Parse check is capable of working well with most of them.

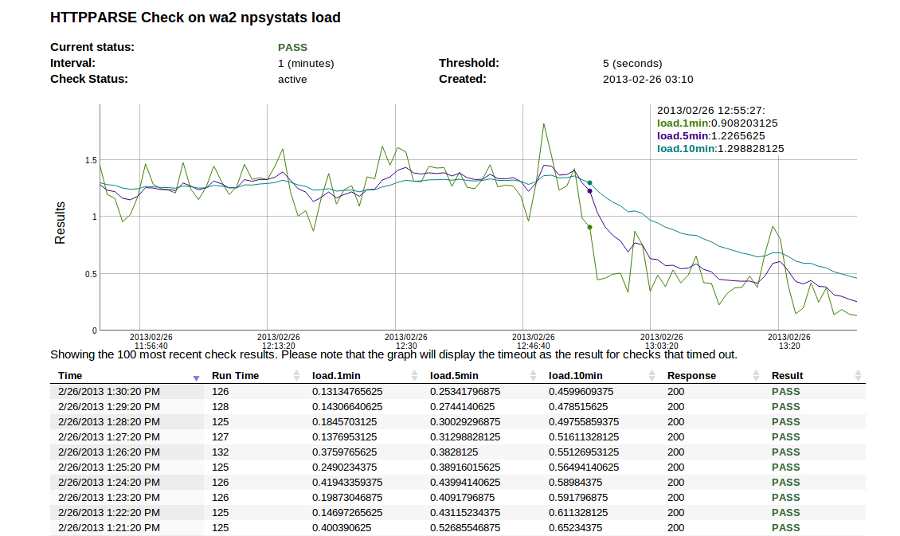
For example, we have a check on a web server that monitors server load. npsystats returns the following json in response to the check’s HTTP GET request:
{"load":{"1min":1.86376953125,"5min":0.9501953125,"10min":0.64404296875}}
The check is set to watch three fields: load.1min, load.5min, load.10min, with a range of 0 to 8 (it could be different for each field, but it doesn’t have to be). So if the load on this server goes over 8, I will get an email. I also can access a graph showing the 1, 5, and 10 minute load for this server.

More information can be found in our documentation for the HTTP Parse Check. We think this makes NodePing an even more awesome piece of your system monitoring and automation toolkit, particularly when tied to judicious use of notifications and webhooks. If you don’t have an account on NodePing yet, try it out with our 15 day free trial.

Email monitoring done right

For several years before starting NodePing I worked in a number of different roles in IT, including system administration, project management, infrastructure and network management, and development. A sizable chunk of that time was spent at an organization that ran email servers in a number of different countries scattered around the world. Making sure that all of those email systems were working properly and generating useful reporting was a huge challenge, and involved a lot of repetitive manual steps.

Availability report outputNodePing’s monitoring services were largely motivated by the desire to make widespread monitoring of web sites and other Internet accessible services as simple and automatic as possible. One of the reasons I’m so excited about our suite of email monitoring checks is that I know from personal experience how important these tools are, both from a sys admin’s point of view as well as from technical management roles.

The core of this set of tools is SMTP monitoring. This check has several options that allow you to check the remote SMTP server in a variety of ways. At its most basic, it can be used to check that the server is operating and answering to SMTP connections and is accessible. It can also watch the SSL/TLS certificates, and notify you in advance of when certificates will expire. The check also can be used to monitor if the SMTP server accepts or denies specific email addresses, which can be used for open relay monitoring. Authentication verification can make sure that the server is logging people in properly. This is particularly important when email servers are integrated with separate directory services, such as an LDAP service or Active Directory.

SMTP server monitoring should also be paired with RBL monitoring. This checks the server’s address against a number of different RBL services, and can notify you if the server has been blacklisted. Any experienced email administrator knows that staying off of these lists is critically important, and it is possible to get on a black list without doing anything outside of normal business practices. When it happens you need to know quickly so you can remedy or clarify the situation and get off of the black list before it negatively impacts business.

The IMAP and POP checks go hand in hand with the SMTP check to ensure that your customers and employees can retrieve mail from their inboxes. Like the SMTP check, these checks not only monitor that the server is accepting connections, but can verify authentication and warn you in advance if an SSL certificate is nearing expiration.

The final piece of the email service monitoring tool set is monitoring the web interface. Here NodePing’s HTTP Content check can be used to make sure that the service is responding with the proper web page, and the SSL check can verify that the web interface’s SSL certificate is in place and working properly, as well as warn of a nearing expiration date.

These checks together provide a full complement of tools for monitoring email services. For most systems, we’d suggest a full set of checks:

  • The SMTP service is operating properly on port 25, accept a STARTTLS command, accepts authentication, and accepts a given address for relay from an authenticated user. All of this, with verification of the TLS certificate, can be done with one check.
  • The SMTP service is listening and accepting SSL based connections on port 587.
  • The SMTP service rejects open relay requests.
  • The SMTP service accepts a local address from non-authenticated hosts.
  • The server is not on any RBL’s.
  • The IMAP server is operating properly on port 143 and authenticating properly
  • The IMAP server is operating properly on port 993 and the SSL certificate is good
  • The POP server is operating properly on port 110 and authenticating properly
  • The POP server is operating properly on port 995 and the SSL certificate is good
  • The web interface is operating properly on port 80 (if that is supported)
  • The web interface is operating properly on port 443 and the certificate is good.

This is a long way from a check that just monitors if a port is listening somewhere. It is the full set of checks that together help to ensure a healthy email system. We continue to extend our monitoring service and make our checks smarter, with the goal to take as much of the manual busy work out of the hands of busy administrators and allow them to focus on tasks that use their actual skills.

If you are responsible for email servers and haven’t added NodePing’s monitoring to your tool set yet, sign up for our free trial and give a try!

Don’t let your certificate expirations catch you offguard

Microsoft’s recent slipup with a certificate that caused outages for the Azure service is a reminder for the rest of us to make sure we are keeping a close eye on certificate expirations. Having a certificate expire on you makes you company look really inept, but in practice keeping track of certificates and when they expire can be a pain if you are trying to do it manually. A system that monitors certificates and reminds you before they will expire can be an excellent way to avoid having this happen to you, and is much easier than tracking them in a spreadsheet or sticky notes.

NodePing provides a few different ways to keep ahead of certificate expirations. For web servers, we have an SSL Check specifically designed to check the validity of SSL certificates and warn you a set number of days before they expire. You can set the number of days to anything that is useful for you. We typically suggest a couple of weeks in advance of the expiration.

Certificate expirations can also hit other types of services as well. Our email checks (SMTP, POP, and IMAP) can verify the SSL/TLS certificates used by each of these servers. Similar to the SSL check for web services, these checks verify that the SSL certificate is valid and working, and also can be set to warn you a certain number of days before they expire.

Tracking your certificates can be a pain, but it doesn’t have to be. Using an automated monitoring system like NodePing for SSL Certificate monitoring can make the task easy and painless, and let you focus on more interesting things.

New Uptime Reporting

Recently we have been working on some of our reports. As a part of that process, we are releasing a new uptime report. The report allows you to see uptime statistics for an individual monitor grouped by days or months. This allows you to get accurate reporting for any check for any given month for which data is in our database.

You can set arbitrary date ranges for the report. This report is publicly available if you have public reporting turned on for the check. As with our other reports, it is available in a web page, as JSON, or CSV format. The report is described in more detail in our report documentation.

The same uptime data is also available through the API.

We will be adding additional views of this data in the near future.

NodePing site update

We updated the web application that provides the front end to our website and server monitoring service today. Most of the changes to the site are incremental improvements. Most notably, we’ve been working on our billing system to make it more flexible and support tiered billing.

At the same time, we have made a minor adjustment to our Terms of Service. Ironically, the change to our Terms of Service is about changes to the Terms of Service. In light of some recent news stories about other companies, we wanted to make it clear that our ToS can change, but that changes impact you when you have actual notice of the change. We don’t have any intention of sneaking in changes that materially alter what you agreed to when you signed up without giving you notice and a chance to decide if you wish to continue to use the service.

We will continue to work on improving and extending our service. NodePing is already an outstanding monitoring service and an excellent value. We are committed to providing the best monitoring service for the best price. We think we are already doing that, and we plan to make it continually better yet.

Your feedback, as always, is welcome both here in the comments, on our Contact page, or in email to support@nodeping.com.

New Performance Summary Report and Updated Public Reports

Web site developers spend a significant amount of time and effort optimizing the site so that it loads quickly and performs well for their visitors. All of that effort is wasted if the web server performs poorly. One of the key uses for website monitoring is keeping an eye on web server performance to make sure that piece of the visitor’s experience is working optimally.

NodePing Monitoring Results Summary Report
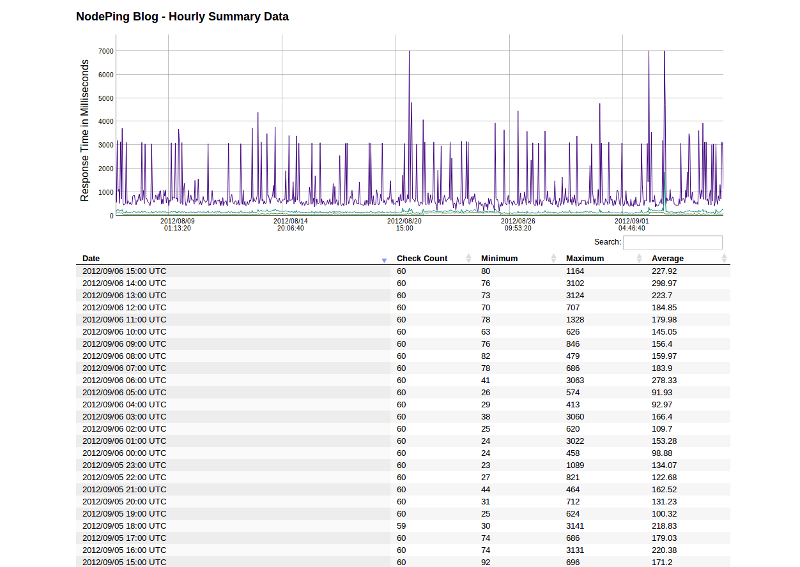
We have implemented a new report to help with this task. The Performance Summary report shows the minimum, maximum, and average response time for a site over an hour. By default, the report shows the last 31 days of performance data. As with the results report, you can change the number of results shown by editing the number on the report’s URL.

Of course, this isn’t limited to just web site performance. This report is available for all monitoring on NodePing, so you can see the same thing for ping results, ssh checks, email checks, and the whole range of other service monitoring we provide. In particular, this type of information is useful in ping tests to routers to watch connectivity performance over time.

We have also adjusted the way our “Public” reports feature works. The summary and results reports are now available if you are logged in to your NodePing account, even if the “Public” access is turned off. The “Public” toggle still controls whether the report is visible to visitors who are not logged in. We also changed the URL’s to better reflect that it is the same report with a different format. The results reports are now all at /reports/results/ (although the old URL’s will continue to work). You can retrieve the data in JSON or CSV format by adding ?format=csv or ?format=json to the URL. For CSV output, you can add a file name to the URL as well for convenience (so the URL would end in /filename.csv?format=csv). Documentation can be found in our reports documentation.

We are continuing to work on improving and expanding our reports. Please let us know what you think, and what you want to be able to see from the monitoring reports. Our continuing goal is to make NodePing not only the most cost effective, but also the most useful monitoring service anywhere.

Introducing NodePing’s Monitoring API

This is Part 1 in a series of posts we’ll have in the coming weeks detailing various aspects of NodePing’s new API. The API allows customers to manage most aspects of their site and server monitoring through an HTTP accessible RESTful interface. It provides list, read, write, and delete functionality for subaccounts, contacts, contact groups, and checks, as well as allowing you to retrieve checks and notifications. Access to the API is included in our service at no extra cost.

The API supports HTTP methods for most calls:

  • GET for listing or retrieving specific records,
  • PUT to update a record based on its ID,
  • POST to create new records (IDs are assigned automatically), and
  • DELETE to delete records.

All responses are JSON.

The API’s authentication is token based. You can find your token in the Account Settings area of your account, or if you’re logged in to the service it is also displayed on the Documentation page.

Documentation is available at https://nodeping.com/API_Documentation. Reference docs showing all supported calls are at https://nodeping.com/API_Reference.

Here’s an example of updating a monitoring check:
curl -X PUT -d'json={"threshold":4, "target":"http://www.example.com/index.html", "enable":"true", "notifications":[{"SKTUSP":"Days"}]}' 'https://api.nodeping.com/api/1/checks/201205050153W2Q4C-1FOC0YYM'

The response to that call would look something like this:

{
  "_id": "201205050153W2Q4C-1FOC0YYM",
  "_rev": "4-5069940f2a95fc6ae5564e329da755bd",
  "customer_id": "201205050153W2Q4C",
  "label": "Site 2",
  "interval": 1,
  "notifications": [ { "SKTUSP": "Days" } ],
  "type": "HTTP",
  "status": "modified",
  "modified": 1337744587374,
  "enable": "active",
  "public": false,
  "parameters": {
    "target": "http://www.example.com/index.html",
    "threshold": 4,
    "sens": "2"
  }
}

Since the API is brand new, we would really like to hear from people who start using it in real situations. Please let us know what works well, and what we could do to make interacting with the API easier.

NodePing Tips – Using the Status Filter

NodePing allows you to watch up to 1000 web sites or services. Some of our customers monitor dozens or even hundreds of web sites. Others monitor several web sites, plus DNS, FTP, SSH, and a variety of other services. The sites and services being monitored are surprisingly varied, and scattered across the globe.

Lately we’ve been working on our UI to make it work better for all of the variations in how the service is used, especially for customers with a larger number of checks. Several enhancements have been made to the main Status list. Putting more information at your fingertips.

One enhancement that is surprisingly powerful is the dynamic filtering of the status list. If you type in the Search box at the top right of the list, the list of checks is dynamically filtered as you type. The filter continues to be applied as the information is updated. This means, for example, that you can type “FAIL” in the search box and it will list only the services that are currently listed as failing. As services change from PASS to FAIL and back, they will appear and disappear from the filtered list dynamically. This gives you an instant list of those services that are failing that you can just keep on your screen and it keeps itself updated.

Another use of the search filter is viewing groups of checks with common attributes. For example, you can view all web site monitoring by typing http in the search, which will display all of the checks with an HTTP type or with “http” in the label. This is even more useful tied to careful use of check labels. If you include the word “router” in the label for all your checks of routers, that makes it very easy to list them together using the search. You could also use this to list monitoring checks of a specific network, client, or location.

The search filter is made possible by the capabilities of the DataTables plugin. Recent versions of DataTables have added some key features that have made our lives much easier in developing a rich interface for our web application.

We hope the new enhancements to our UI make the service even more useful, and we’re looking forward to hearing about the ways people use it that we didn’t think of.

Monitoring results now available in JSON and CSV formats

Many of our customers monitor their own customers’ websites, or they monitor services about which they have to periodically report availability and incident statistics. Many of them would like to include status information in their own dash boards or integrate results with other data in reports. All of that calls for the data to be available in formats that can be easily used by scripts, or easily imported into spreadsheets.

NodePing has now added the ability to retrieve monitoring results in JSON and CSV format. JSON is ideal for scripting situations, such as creating your own dashboards or views of the data. CSV is great for loading the results data into your spreadsheets for analysis or creating reports for customers or management.

Both of these formats are available as extensions to our public reporting feature, which we added a while back. When you turn on public reporting, you are given a UUID that identifies that check. The same UUID can be used to access the data as a public report (you need to know the UUID, which gives you some control over who sees it, but does not require a login), as JSON output, or as a CSV download.

You can read more about these features and see some sample URLs on our Reporting page in the NodePing Documentation.