Monitoring the Server Room with NodePing – Part 2: Sense HAT

In Part 1, I talked about getting started with monitoring my server room with NodePing’s PUSH and AGENT checks and the Raspberry Pi. On my continued path of server room monitoring I wanted to look into environment monitoring with the Raspberry Pi and NodePing’s PUSH checks. To follow up, I sourced a Sense Hat so I could bring a simple way to monitor my climate and get alerts on the metrics with NodePing. The Sense Hat has the capability of monitoring temperature, humidity, and atmospheric pressure. In this post, I will look at how you can integrate the Sense Hat into server room monitoring, configure notifications, and the pros and cons I found when testing the Sense Hat.

The Hardware

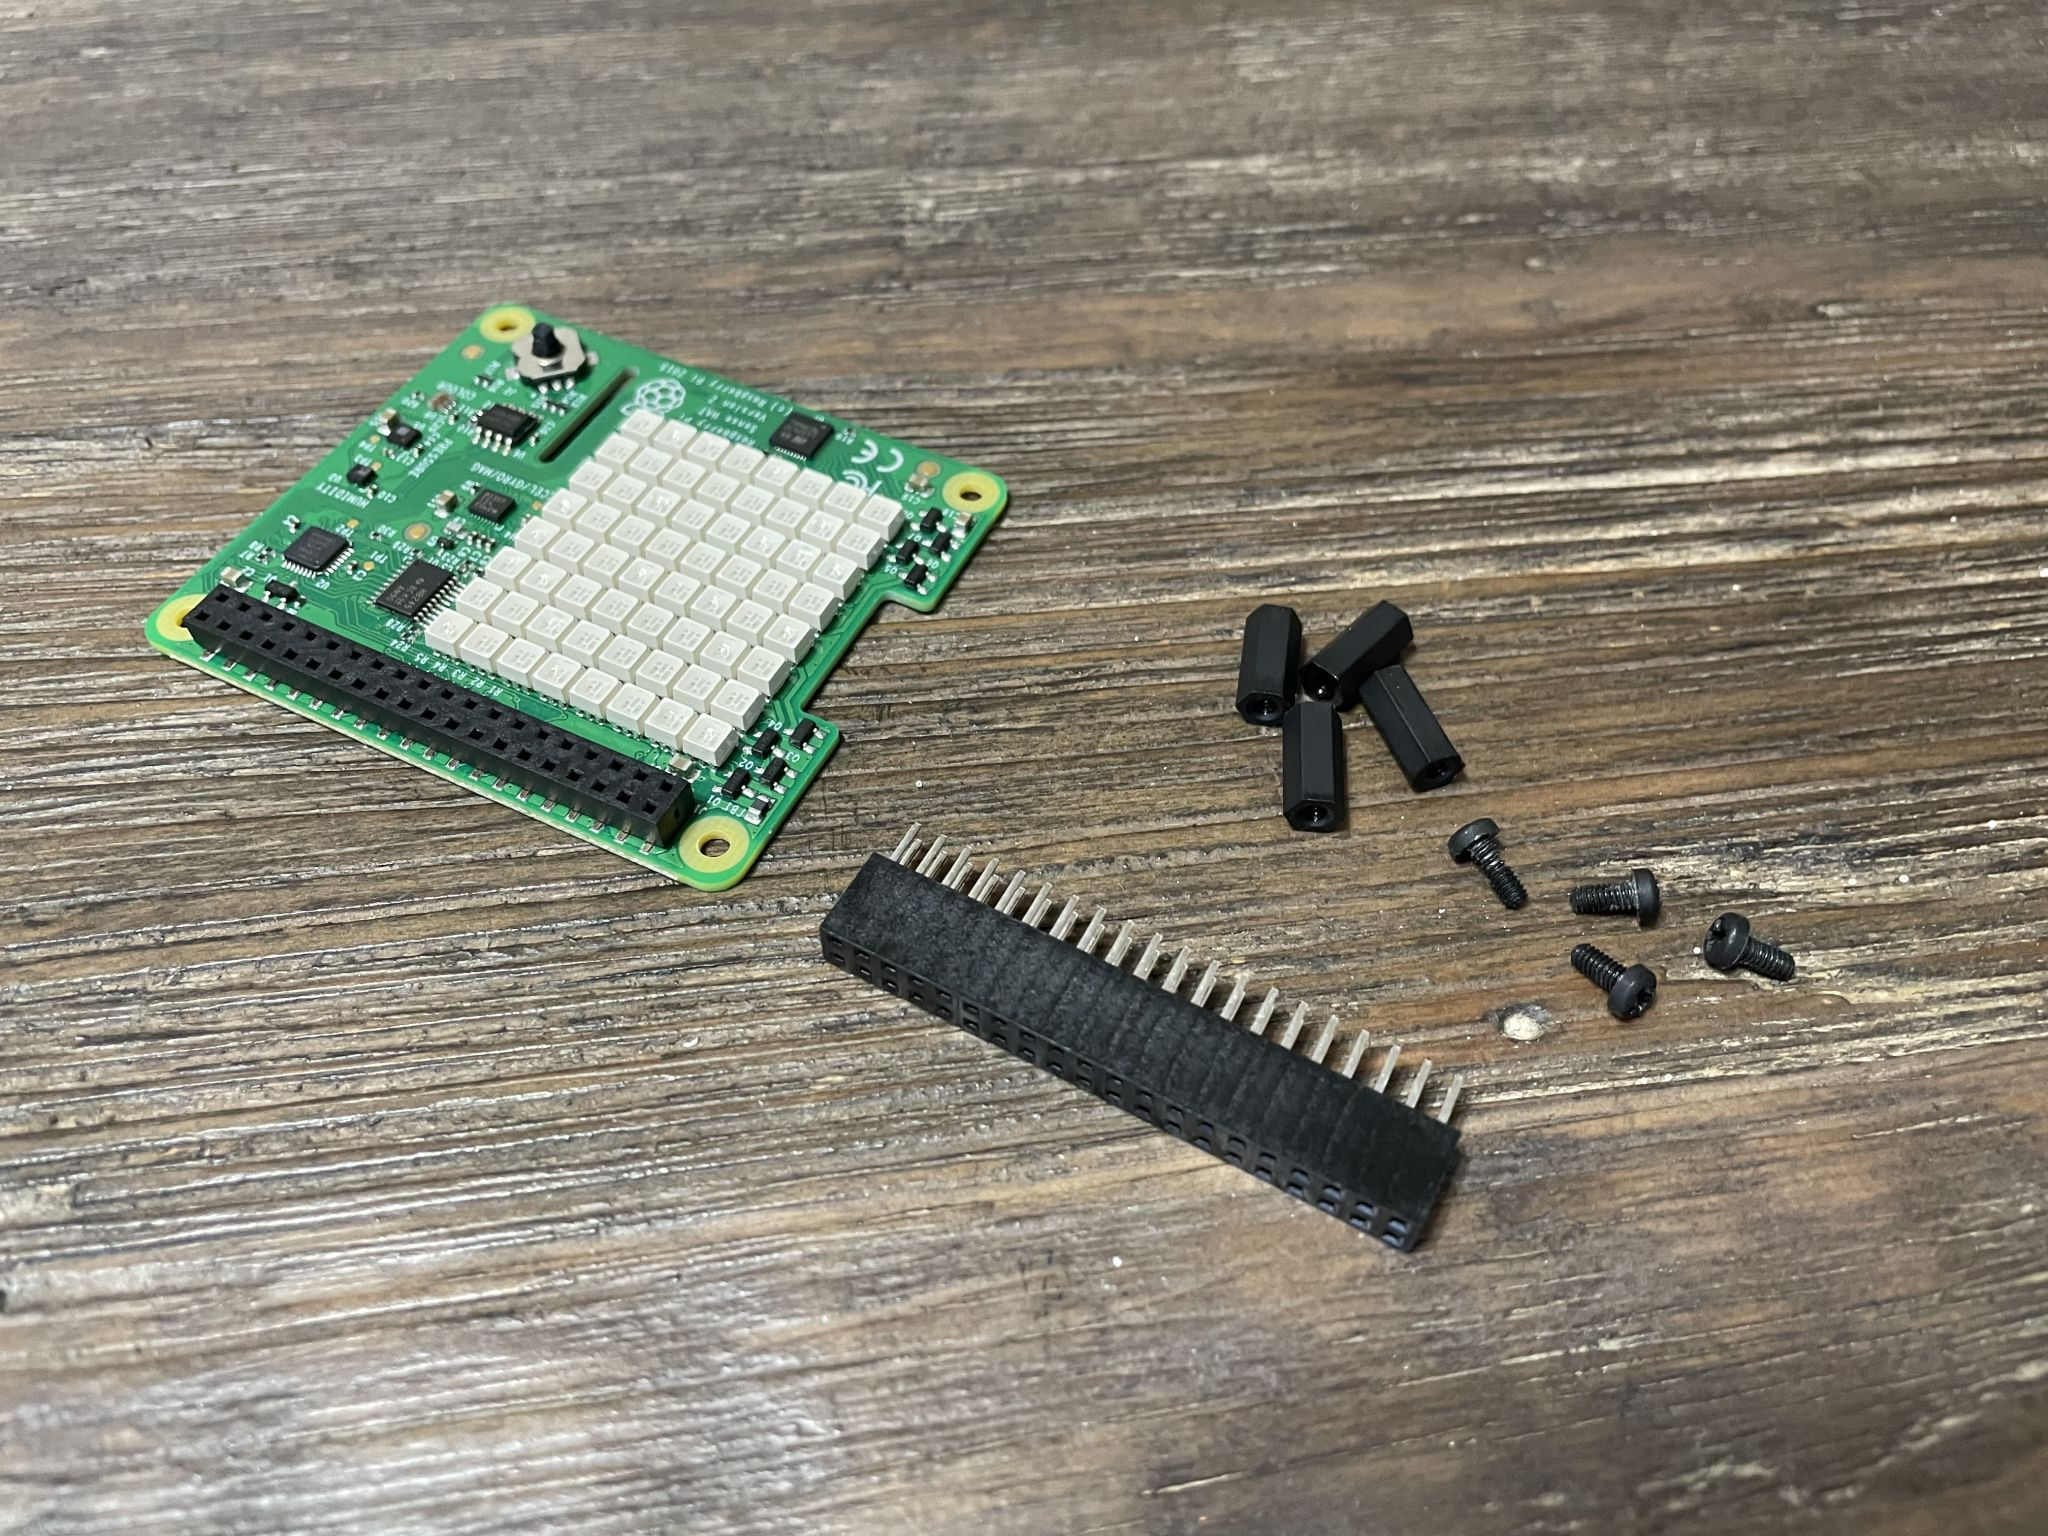
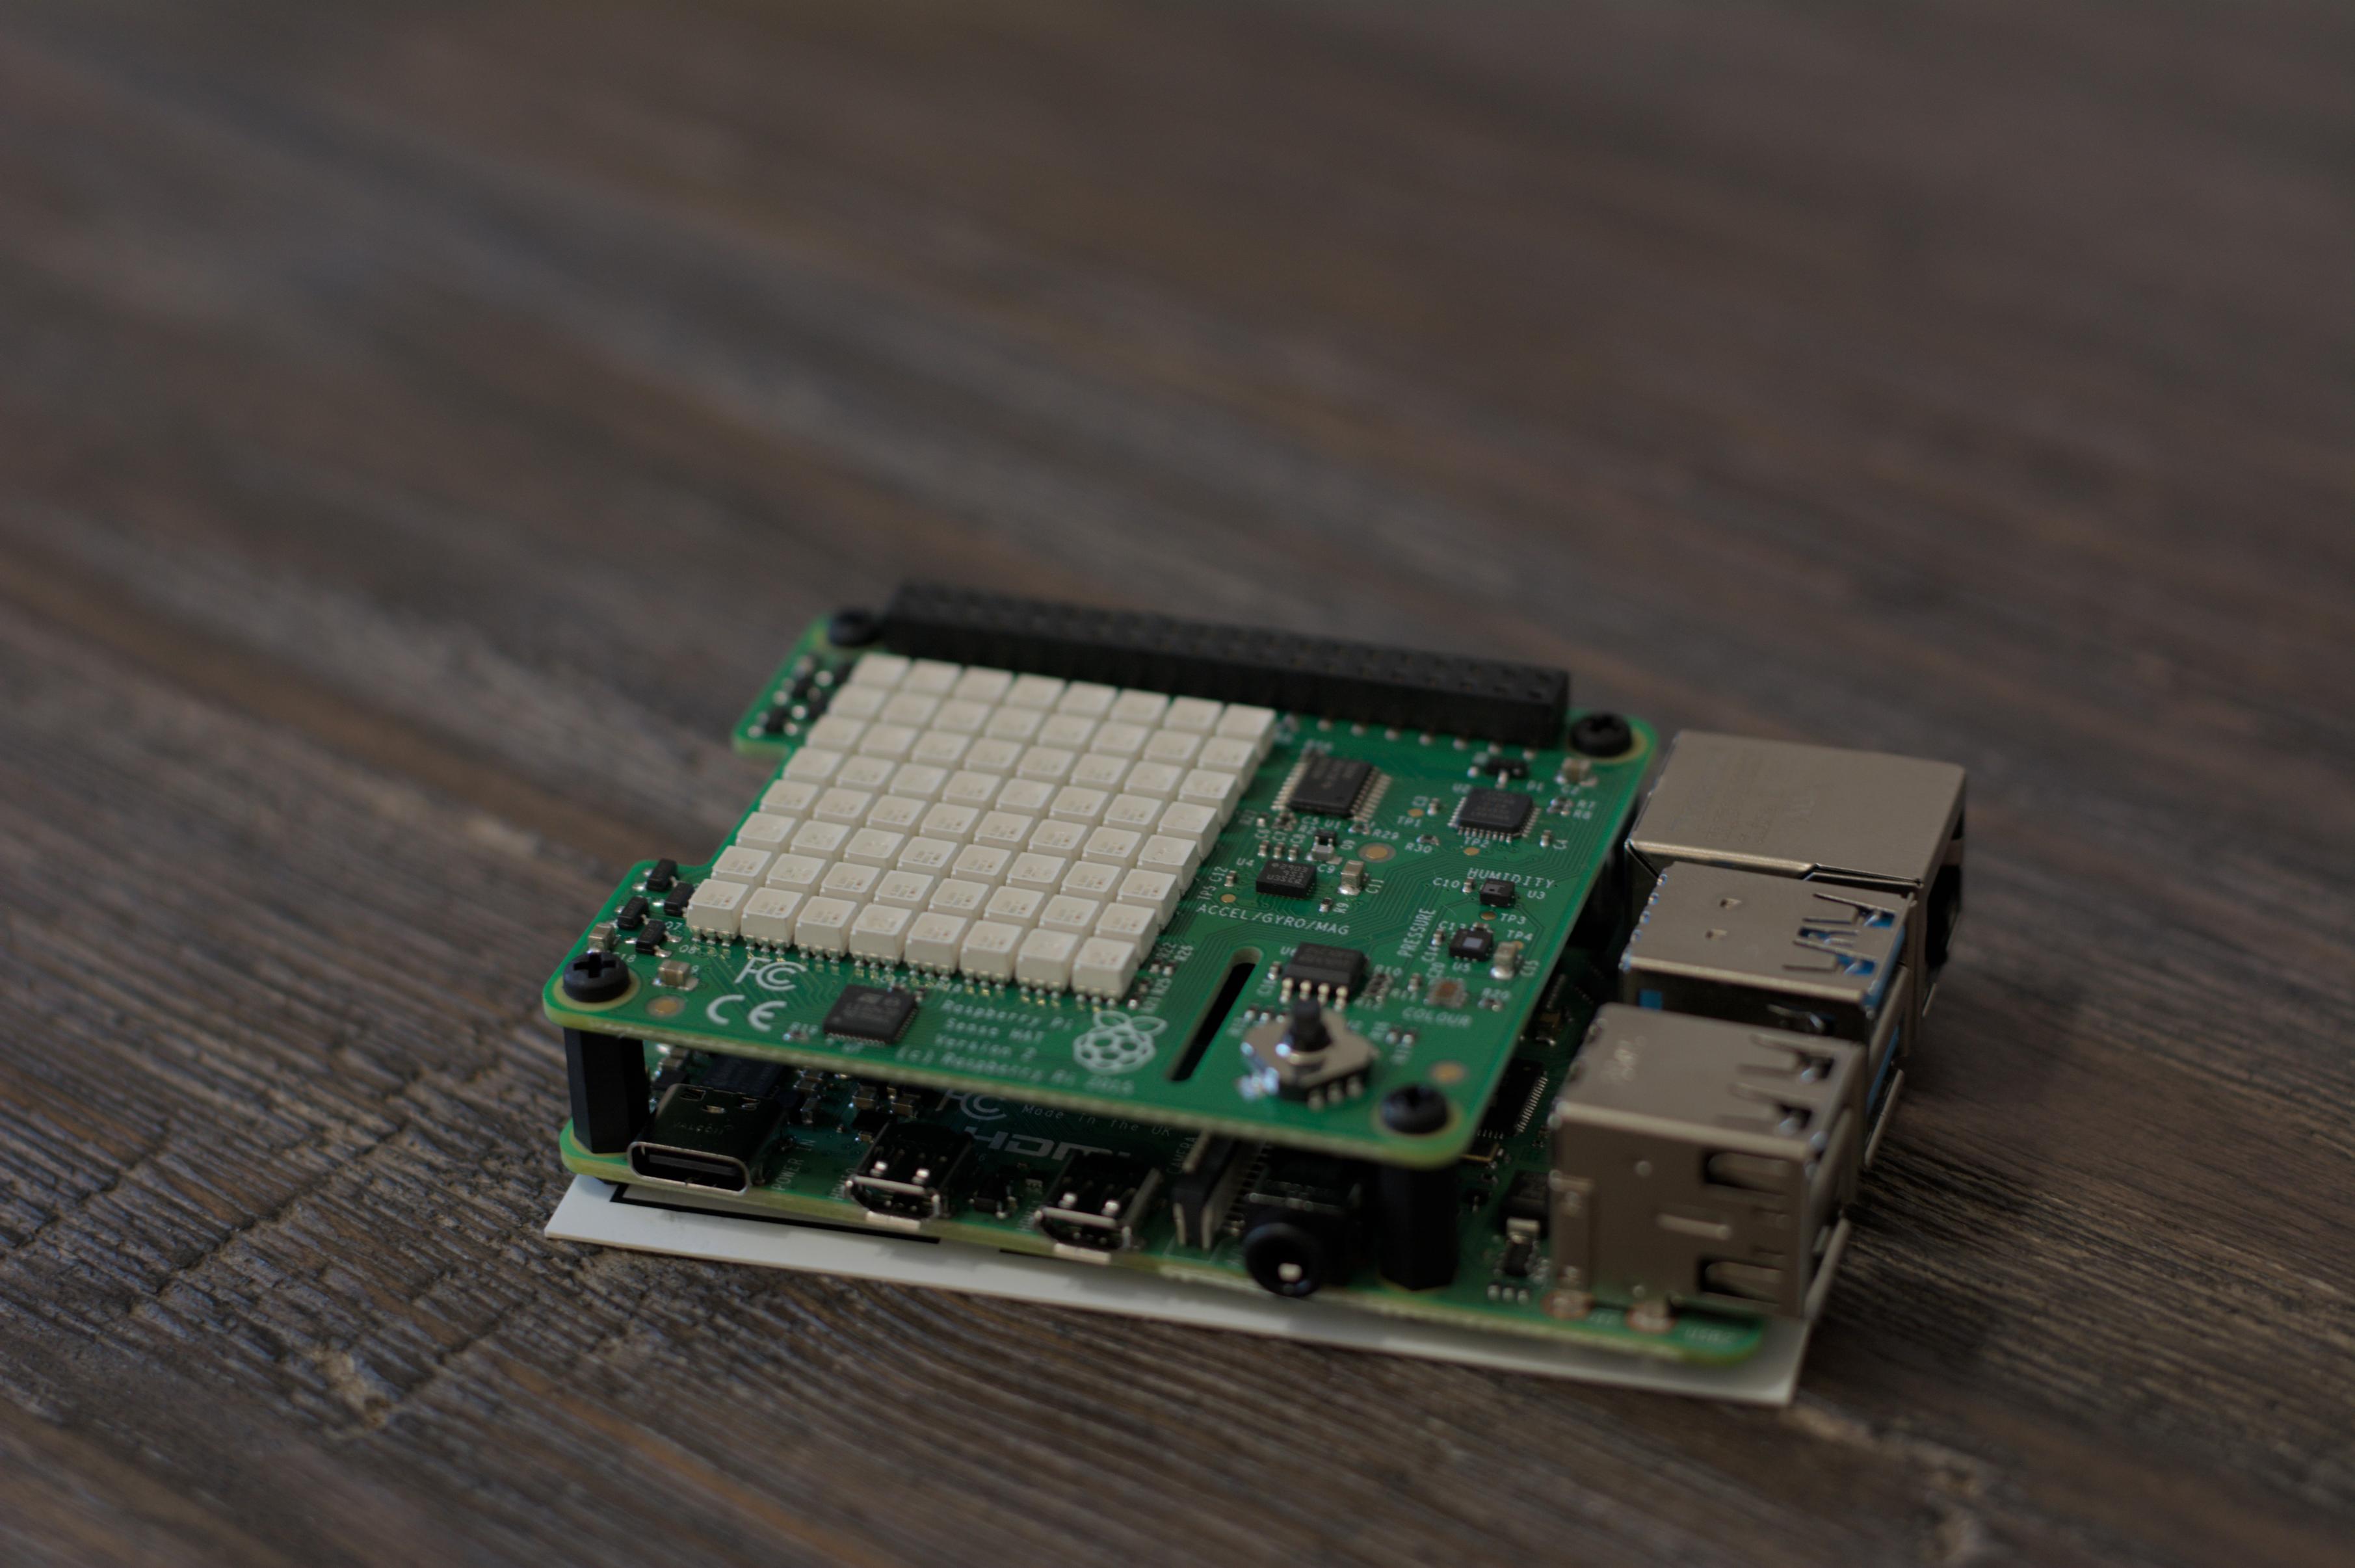
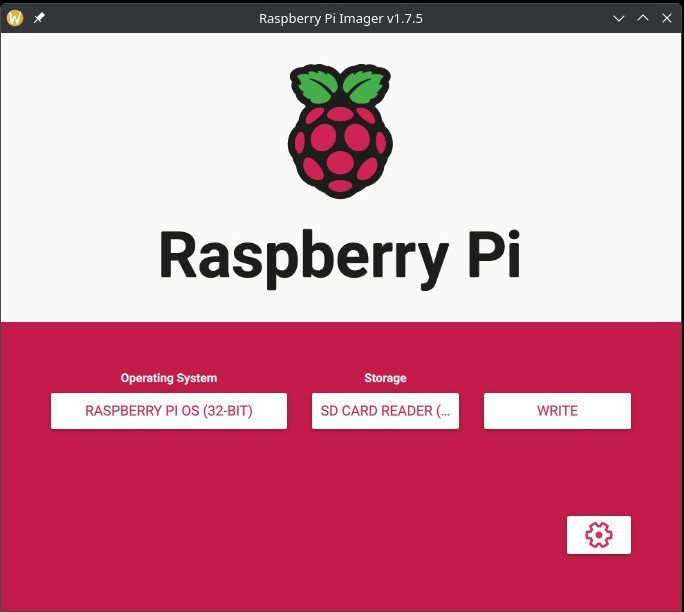
To start, the Sense Hat has to be installed. My Sense Hat came with some extra screws and standoffs, as well as a GPIO riser. I’ll use them and a compatible case to secure my Raspberry Pi and Sense Hat. Once the pieces were assembled together, I installed Raspberry Pi OS to a microSD card. The easiest way is to use the Raspberry Pi Imager like in the previous blog post. I put the formatted microSD card in the Pi and connect Ethernet and power.

The Software

There is only one extra dependency that I needed, and it may even be installed on your Raspberry Pi already. To be sure, I installed it with this command:

$ sudo apt install sense-hat

That is all that is needed in addition to what is in the base installation of Raspberry Pi OS.

Creating the PUSH Check

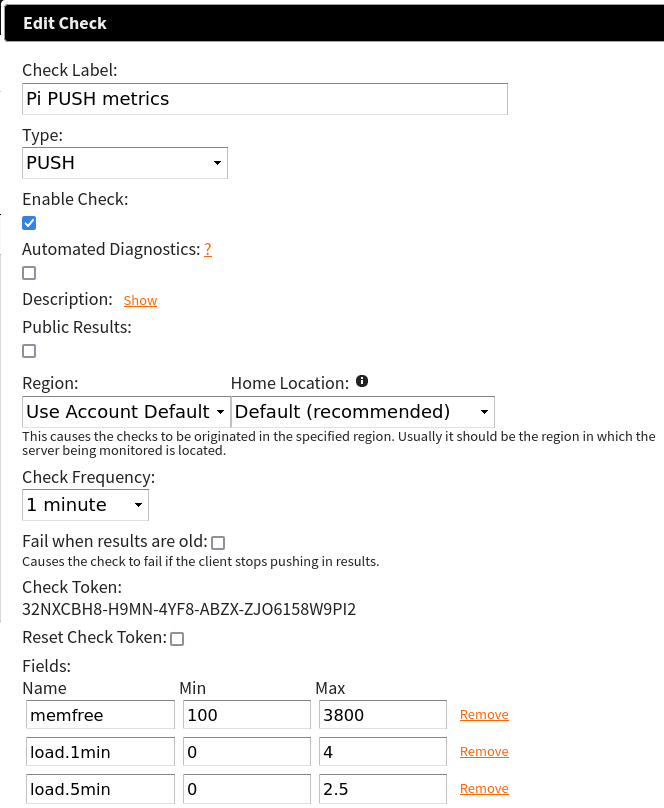
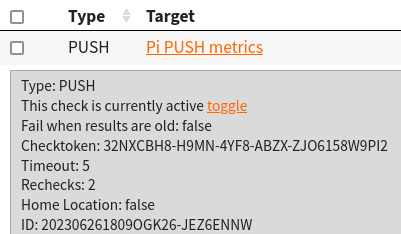
To start using the Sense HAT metrics with NodePing, I signed into NodePing and created a PUSH check. The check looks like this:

Below in the Fields section, the names should be:

  1. pisensehat.temp
  2. pisensehat.humidity
  3. pisensehat.pressure

Adjust the min/max values accordingly to what you consider a safe temperature. NodePing provides a Sense Hat Python 3 module for PUSH checks to monitor temperature, humidity, and atmospheric pressure called “pisensehat”. Not only will it submit the values to NodePing, but it also takes advantage of the Sense HAT’s LED array and will display basic environmental information so you can visually see the temp/humidity/pressure on the display.

User Setup

Out of the box, the first user I made belonged to the right groups to use the Sense Hat. However, I wanted to use a different user to run my PUSH client, so I ran this usermod command to add the pi user to the necessary groups to work with the Sense Hat:

$ usermod -aG video input gpio i2c pi

Configuring the Client

Now that the check is created, I moved on to installing the PUSH client software on the Pi. To get the PUSH clients code, I can visit the GitHub page to download a zip file or I can use git to fetch the code directly using the following command:

$ git clone https://github.com/NodePing/PUSH_Clients.git

From here, I made a copy of the Python3 client. A convention I tend to follow is to create a folder named something like “server_room_climate_202306261808OGK26-JEZ6ENNW” where name is the label of the PUSH check in NodePing, and the check ID that is generated when you create that check in the NodePing web interface.

I created those folders using the command:

$ mkdir -p push-clients/server_room_climate_202306261809OGK26-09S996LV

You can call your folder whatever you want. I use this so I can easily find the right PUSH check in NodePing that corresponds to this PUSH client.

I will be using the pisensehat module to monitor my server room environment. The pisensehat module does a bunch of different things. It:

  1. Collects temperature, humidity, and pressure values
  2. Formats the data to send to NodePing
  3. Lets you control the LED array
    • Turn it on/off
    • Rotate the LED array
    • Shows the status of your configured ranges for temperature(T), humidity(H), and air pressure(P):
      • Red = higher than the safe configured range
      • Green = within the safe configured range
      • Blue = lower than the safe configured range

I copied the Python3 client code into the directory I made and cd’d into that directory for easier editing:

$ cp -r PUSH_Clients/Python3/NodePingPython3PUSH/* push-clients/server_room_climate_202306261809OGK26-09S996LV/
$ cd push-clients/server_room_climate_202306261809OGK26-09S996LV/

To make the PUSH check work, I have to edit 2 files:

  1. config.ini
  2. metrics/pisensehat/config.py

At the end of config.ini, there is a modules section. It should contain this information:

[modules]
pisensehat = yes

You also want to include your check ID and checktoken in the server section

Next is the config.py file for the module. Configure this to your own needs. Mine contains this information:

# True if you want to output colors to LED array
LED_ON=True

### ROTATION
# Rotate 0,90,180,270 degrees to change orientation of LED array
LED_ROTATION=90

### TEMPERATURES
# C for Celsius or F for Fahrenheit
UNIT="F"
# Colors status
MIN_OK_TEMP=60
MAX_OK_TEMP=90
# The SenseHat temp is off by a little but can be corrected
# to compensate for the CPU temp contributing some heat
TEMP_CALIBRATION = 1.0

### HUMIDITY
MIN_OK_HUM=30
MAX_OK_HUM=70

### PRESSURE
MIN_OK_PRESSURE=29
MAX_OK_PRESSURE=31

Important information of note:

  • If you want the LED array to show you info, set this to True
  • If the LED output is upside down you can change its rotation by modifying LED_ROTATION
  • If you are submitting temps in Celsius, set UNIT="C"
  • The min/max for TEMP, HUM, and PRESSURE should match what was entered when you created the PUSH check on NodePing. These values will determine the color output on the LED display
  • I will talk more about TEMP_CALIBRATION later

The client should be configured now. I will now test it by running:

python3 NodePingPythonPUSH.py --showdata

This will let me see the data that would be sent to NodePing without actually sending it. This is just for testing and is a good way to make sure I edited those files correctly without impacting any uptime stats for the check in NodePing.

Lastly, I need to set up cron to run my PUSH client on a regular interval. I want this one to run every minute, so the cron line will look like the one below. To edit my cron tab, I run crontab -e and add the following entry:

* * * * * python3 /home/pi/push-clients/server_room_climate_202306261809OGK26-09S996LV/NodePingPythonPUSH.py

Now my check is running every minute and submitting my server room climate info to NodePing. This will allow me to track temperatures and humidity in the server room and notify me if the room is too hot/cold, humid/dry, and if the air pressure is too high/low.

Note on TEMP_CALIBRATION

While creating the pisensehat module for Python3, I noticed an odd problem with the Sense Hat that turns out to be a well known issue. The temperature sensor on the Sense Hat will change with the temperature of the processor. So if for example, you have a load average of 0.0 on the Raspberry Pi, the temperatures may be just 5 to 10F hotter than the actual ambient air. However, if the load goes up, the processor heats up and the temperature sensor will read much hotter. This will result in inaccurate readings for the room.

To best offset the temperature problem, I included a TEMP_CALIBRATION number in the config.py file. This is a best-effort method of calibrating the sensor to work with the current room temperature and account for the heat produced by the Pi’s processor. In my testing while running the NodePing AGENT and the pisensehat PUSH check, setting the value to 1.0 was relatively consistent with my other thermometers. The number could be different for you, and it is important to know that if your Pi’s load increases, so will your reported temperatures.

I have tried another sensor to work around the temperature issue with the Sense Hat, but I will save that for Part 3.

Another Issue

Another issue I came across in my Sense Hat testing was with the pressure sensor. The very first reading after boot seemed to report back a 0 no matter what. To fix this issue, the module reads from the pressure sensor two times to ensure it does not get and submit a 0.

Pi in the Wild

I have the Pi ready to go now. I took it to one of my networking rooms so I could monitor the environment in there. This room isn’t in any sort of datacenter so the conditions are more harsh with limited temperature and humidity regulation. The Raspberry Pi is perfect for this location so I can know if the air conditioning goes off, or if the humidity gets too low in the drier winter climate.

I connected the Pi to the switch and power and not long after starting up, the cron job started checking the environment and showed all green on the LED array. Success!

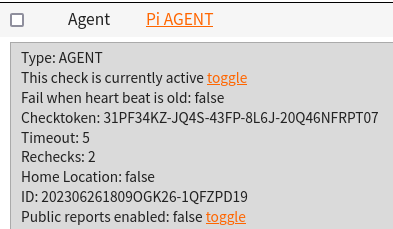
With the Raspberry Pi in place and monitoring my server room, I not only get the power of NodePing PUSH checks running on the Pi, but I also have an AGENT running to do some additional internal monitoring, as well as monitoring outbound connectivity.

If the temperature, humidity, or pressure fall outside of my configured ranges, I will be promptly alerted of the issue with the notifications I configured for the PUSH check. Additionally, if I am on premise, I can view the LED display to see if any of those environmental metrics is too high or low.

Check Status Reports

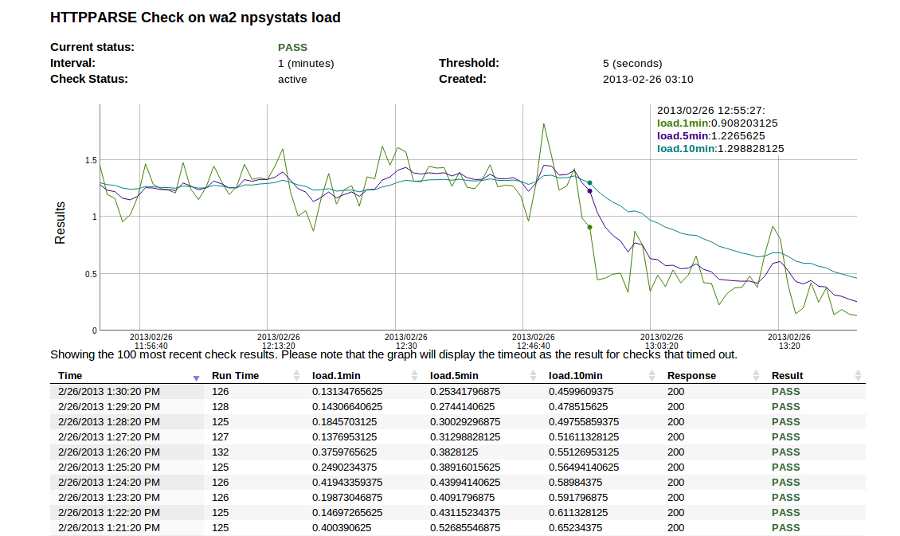
I like to have a visual graph of my environmental status so I created a status report page to get a visual representation in my browser of the environmental info from my check.

Now I have a live graph I can use to watch what is happening in my server room at this moment and over the last few hours. This is helpful for me to watch trends in my temperature, for example.

More to Come

Thanks to its versatility and availability of software packages, there is a lot that I can do with the Raspberry Pi to monitor my services and my surroundings. In Part 3, I will swap out the Sense Hat for a DHT22 sensor for monitoring instead of the Sense Hat to see if I can get better temperature readings without relying on mathematically offset values.

If you don’t yet have a NodePing account, please sign up for our free, 15-day trial.

Monitoring the Server Room with NodePing – Part 1

Monitoring services inside the server room is pretty easy with NodePing. I’m going to show you how I can keep an eye on my server room and its services using NodePing PUSH and AGENT checks. In this scenario, the room only contains network devices, so I chose to stand up a Raspberry Pi. It will also let me add temperature and humidity sensors in addition to monitoring stuff inside the firewall.

NodePing offers two different check types to allow me to do on-premise system, sensor, and network monitoring: PUSH and AGENT checks.

PUSH checks allow me to send heartbeats from any server to NodePing. I can also use the metric tracking to do things like monitor load, disk space, memory usage, and more. Basically any numeric value I can read or generate on a box can be submitted, tracked, and trigger notifications.

NodePing AGENT checks allow me to configure NodePing probe functionality, installed and maintained by me and available only to my NodePing account. I can use my AGENTs to run other NodePing checks from anywhere, even inside my private network, without needing to open up any firewall ports.

The PUSH and AGENT checks can run on a wide variety of hardware. In this blog post, I would like to show you how I configure NodePing on-premise monitoring tools to work on a Raspberry Pi.

Setting Up

To get started with setting up the Raspberry Pi, I use the Raspberry Pi Imager to configure an appropriate version of RaspberryOS. I can use either the 32-bit or 64-bit options. Watch this quick video from Raspberry Pi on how to use their installer. The Imager can be obtained from their website. Below, I chose to use the default, and very popular, Raspberry Pi OS 32-bit. You can also select the 64-bit option as well as the Lite versions which are designed for headless installations if you don’t need a desktop environment. NodePing PUSH and AGENT checks work with all the different flavors of Raspberry Pi OS.

I intend on using this Pi in a headless configuration, without a keyboard or monitor always connected, so I go into the “Advanced Options” page in the imager and enable SSH. I’ll also need to configure a user, password, and necessary networking. It will need internet access either via wifi or ethernet to send check results to NodePing. I’m going to use one of the Lite versions in this case to reduce the amount of extra software that gets installed.

Enabling SSH, authentication settings, and setting a username and password.

Once the microSD card is imaged, I insert it into my Pi and fire it up… waiting for it to boot. I’m able to SSH in! Good start.

From here, I do some further SSH hardening and require the user I configured to have the password entered when I do any sudo commands.

Additionally, I update the packages on my Pi.

$ sudo apt update
$ sudo apt upgrade

Installing the PUSH Clients

PUSH checks can submit any numeric metrics to NodePing using an HTTP POST, and be used to trigger notifications of the PUSH check. The PUSH payload schema is discussed in the PUSH check documentation. I can also use one of the pre-defined clients available on GitHub. Currently, NodePing provides PUSH clients written in POSIX shell, Python, and Powershell. The POSIX shell scripts and Python scripts will work on the Raspberry Pi. If I want to use a different programming language to create my own client I might want to use the existing code as a reference.

I’m going to go with the POSIX client. To get the PUSH clients code, I can visit the GitHub page to download a zip file or I can use git to fetch the code directly using the following command:

$ git clone https://github.com/NodePing/PUSH_Clients.git

From here, I can either use the clients from the directory that was cloned, or make a copy of the individual client elsewhere. A convention I tend to follow is to create a folder named something like “pi_push_metrics_202306261808OGK26-JEZ6ENNW” where name is the label of the PUSH check in NodePing, and the check ID that is generated when you create that check in the NodePing web interface.

I created those folders using the command:

$ mkdir -p push-clients/pi_push_metrics_2023-06261809OGK26-JEZ6ENNW

You can call your folder whatever you want. I use this so I can easily find the right PUSH check in NodePing that corresponds to this PUSH client.

Configuring a PUSH Check

Now I’m going to copy the POSIX client from the git clone I made into the new folder I created above.

Installation instructions are available for each of the client types. For now, I will show you a quick demo of how to configure a PUSH client that will monitor free memory, and 1 and 5 minute load averages. I configured my check like so in the NodePing web interface:

This check will pass so long as the free memory is greater than 100MB and less than 3800MB, 1 min load is between 0 and 4, and 5 min load is between 0 and 2.5. This will help me keep tabs on when my system load is too high, and if my Pi is using more or less memory than expected. For the client on the Pi, I am interested in a few files:

  1. NodePingPUSH.sh
  2. moduleconfig
  3. The modules directory

I have to ensure NodePingPUSH.sh and the other .sh files are executable by this system user. For the moduleconfig file I only want to run the memfree and load module so I simply add those in the moduleconfig file.

The contents of the file are only the 2 lines “load” and “memfree”.

For the NodePingPUSH.sh file, I need to add my check ID and its checktoken. These are found in the check drawer.

The only variables needing editing are CHECK_ID, and CHECK_TOKEN.

After configuring those files I will run:

$ sh NodePingPUSH.sh -debug

This will let me see the data that would be sent to NodePing without actually sending it. This is just for testing and is a good way to make sure I edited those files correctly without impacting any uptime stats for the check in NodePing.

Lastly, I need to set up cron to run my PUSH client on a regular interval. I want this one to run every minute, so the cron line will look like the one below. To edit my cron tab, I run crontab -e and add the following entry:

* * * * * /bin/sh /home/pi/push-clients/pi_push_metrics_202306261809OGK26-JEZ6ENNW/NodePingPUSH.sh -l

The -l at the end of that line will make the script log to a NodePingPUSH.log file in that same directory. You can modify the logfilepath variable in NodePingPUSH.sh if you want to have your logs go to a different folder.

NodePing AGENT

PUSH checks are great for pushing arbitrary metrics into NodePing. However, if I want to run one of our standard check types in my network, without creating ingress holes in my firewall, NodePing AGENT checks are the way to go. Once the AGENT software is installed, I’ll be able to run checks directly on this Pi.

Installing NodeJS

To setup the AGENT, I need NodeJS and npm installed. Raspberry Pi OS makes this simple with a single command on the Pi:

$ sudo apt install nodejs npm

With those pieces of software installed, I can clone the AGENT software git repo to get that code. The instructions can always be found in the GitHub repository, but for now, here’s the short version of the commands I ran as an example:

$ git clone https://github.com/NodePing/NodePing_Agent.git
$ cd NodePing_Agent
$ npm install
$ node NodePingAgent.js install 202306261809OGK26-1QFZPD19 31PF34KZ-JQ4S-43FP-8L6J-20Q46NFRPT07

The Check ID and Checktoken in the forth command example above are used to tie this instance of the AGENT running on my Pi to the AGENT check I created in NodePing. They can be found with the check information on the NodePing site:

The node NodePingAgent.js install command will set up the AGENT to run, and at this point I can now create checks on NodePing and assigned them to run on this AGENT. To do that, when I create a check in NodePing, in the “Region” dropdown, I select the name of the AGENT I made. When that check starts to run, I should begin to see it is being run from my AGENT, not the normal NodePing probes.

Here’s an example where I’m pinging an interval server, using the private IP address, from the AGENT on my Pi.

Note that the Region is set to the label we gave to the AGENT check. Now with the AGENT running, I can monitor anything I choose from this Pi, whether the servers are internal or external.

Diagnostics

I want to take advantage of NodePing’s Automated and On-demand Diagnostics so I want to start the Diagnostics Client on my Pi as well using the following command:

node DiagnosticsClient.js >>log/DiagnosticsClient.log 2>&1 &

The Diagnostics Client will allow NodePing to get MTRs, DNS, and other diagnostics to send me when my checks assigned there fail. It makes troubleshooting so much faster and easier.

This is Only the Beginning

Now I have a Raspberry Pi all ready to have NodePing collect a wide variety of metrics with my PUSH check and run as a custom NodePing probe with my AGENT check. I can use them to do all sorts of cool things.

In Part 2, I’ll add some hardware sensors to this Pi to measure temperature and humidity of my rack so alerts can be sent if either goes outside of a safe range. Fun stuff coming.

If you don’t yet have a NodePing account, please sign up for our free, 15-day trial.

Finding the Best Server Providers

Great services need great boxes to run on. How do we know if a server or VPS host is performant and reliable?

We use dozens of different hosts for NodePing and our standards for performance and reliability are really high. There are many SaaS out there that host only on AWS. Putting all your eggs in one basket is nice for billing but would make our service fragile and vendor-dependent. We spread our boxes around to make it resilient and better represent the Internet’s disperate architecture for monitoring.

We have to take new boxes out and put them through their paces; kick the tires and make sure they’re solid. This is how we test out a new provider before we use a dedicated server or VPS.

Blacklisted

As soon as we have our IP assignments from the provider, we check to make sure the IPs aren’t listed in any spam blacklists using NodePing RBL checks. Most of our hosts don’t send any actual email but our public probes do a lot of SMTP connections to ensure our customers’ mail servers are functioning properly. If the IPs are blacklisted, we’ll need a clean IP from the provider or cancel and look elsewhere.

We’ll leave this RBL check running once an hour to make sure it doesn’t get listed half way through our testing period.

Blacklisted IPs can be a good indicator of provider quality even if the server won’t be sending any email. A provider that can’t keep spammers out of their service is unlikely to be able to keep a reliable network.

Incoming Traffic

Solid networks can be hard to find. We test for inbound packet-loss and routing issues using NodePing PING checks. We’ll sometimes test from a few different geographical regions to ensure global routing is stable. Anything less than 100% uptime for 30 days is unacceptable for us. If the provider had announced planned maintenance well in advance, we’d use NodePing’s maintenance feature to ensure the uptime stats remained accurate despite planned outages. In our decade-plus experience, a network that sees even one episode of packet-loss or route failure is going to continue to see them and isn’t stable enough for our use.

We’ll do the same for IPv6 addresses as routing and packet-loss can be independent of the IPv4 stack. Some providers have a hard time keeping their IPv6 blocks broadcasted and we’ve seen IPv6 completely fail while IPv4 continued to function normally.

We enable automated diagnostics for all our PING checks so we can see where on the route the packet-loss or routing failure is happening. Getting immediate MTRs can show us the weak links in a network and if we see issues with some of the usual suspects, we will for sure dump it. Yes, I’m looking at you, Cogent!

Outbound Traffic

Sometimes a network issue seems to only impact outbound routing. We use the AGENT functionality to assign additional PING checks to originate from the server being tested towards some of the other servers it would be connecting to if it’s moved into production. The AGENT software will run NodePing checks just like the public probes but originating from our test host. It’s a great way to detect outbound packet-loss and routing issues from the server. Again, anything less than 100% uptime on this test and the service isn’t going to make muster.

System Load

The performance of a VPS can be greatly impacted by issues outside our control. Two of the most frequent system load issues we’ve seen on VPS are noisy neighbors and host server backups.

A good provider won’t oversell their VPS host servers and will suspend anyone who is abusing more than their fair share of resources. If we end up on a box with noisy neighbors, the system load on our VPS will likely spike, starving our processes from getting the CPU, memory, networking, or storage I/O they need to function properly.

We’ve also come across providers where we saw system load rise every Saturday around midnight (GMT) for 30 mins or so. Turned out their backup process was overwhelming the disks and causing load issues on all the VPS on the host.

These types of issues are simple to find using PUSH checks that monitor the system load. Since we aren’t using these boxes for anything yet, we have to set the thresholds pretty low to detect load issues caused by resource starvation. This is one test that we’ll give a bit of slack to a provider if it fails though. Noisy neighbors or hungry backups can happen to any provider and we’ll give them a chance to find and address the cause. If it keeps happening though, pull the plug on that provider. It’ll just be worse once you start using the machine and an ongoing headache trying to get their support to do anything about it.

If a server can keep humming along for 30 days without any of the checks above failing, there’s a pretty good chance that provider and network are going to be solid and reliable. I hope this look into our vetting process will help you with your provider search for those elusive reliable networks and servers.

If you don’t yet use NodePing, please sign up for our free, 15-day trial and see for yourself how our monitoring can increase your uptime.

Monitoring Memory Usage in Node Applications

I recently started a new node.js project that stored a good bit of data in memory, and talked to clients over web sockets as well as providing a REST interface. The combination of components meant there were several spots that I wanted to monitor.

For the WebSockets, I hooked up NodePing’s WebSocket check. In this case, I didn’t need it to pass any data, just connect and make sure the WebSocket interface was accessible. This was a quick win, and in seconds I was monitoring the WebSockets interface of my new app.

One of our concerns with this particular application was how much memory it would use over time, since it retains quite a bit of data in memory for as long as the server is running. I was curious about how much memory it would end up using in real use. I was also concerned about any memory leaks, both from the data caching and the use of buffers as the system interacted with WebSockets clients. This called for monitoring memory usage over time and getting notifications if it passed certain thresholds.

To accomplish this, I used NodePing’s HTTP Parse check. In my node app, I created a route in the REST interface that would return various statistics, including record counts in the cache and a few other things I was curious about. The key piece for monitoring purposes, though, was the output from the node.js process.memoryUsage() call. This gives me a nice JSON object with rss, heapTotal, and heapUsed numbers. This was in combination with some other stats I wanted to capture, and the output looked something like this:

 {
  "server": {
    "osuptime": 22734099.6647312,
    "loadavg": [
      0.17041015625,
      0.09814453125,
      0.12451171875
    ],
    "freemem": 1883095040,
    "processmem": {
      "rss": 77959168,
      "heapTotal": 63371520,
      "heapUsed": 30490000
    }
  }
}

Next I added an HTTP Parse check in NodePing, and added the rss and heapUsed fields to the check. For the check setup, we use JSONPath syntax, so the full fields looked like this:
server.processmem.rss
server.processmem.heapUsed

At first I was a little startled by the results of this. The rss figure is consistently a good bit higher than the heapUsed number, and it climbs slowly over time. At first glance this looks like the system has a memory leak. However, it turns out this is normal for node.js applications. Node manages the memory used internally, and the rss figure shows what’s been allocated at some point and is still reserved, but not what’s actually in use. The heapUsed figure, on the other hand, does reflect Node’s periodic garbage collection.

I found the HTTP Parse check to be perfect for watching memory usage and checking for a memory leak in my Node application. The key was capturing the heapUsed as reported by Node. In my case I had the check grab this information once a minute, and I quickly had a handy chart showing the total memory usage of my application over time. As a result, trends become quickly apparent and I can see how my memory usage grows and shrinks as Node manages its memory usage.

Since I was hitting the REST interface of my application once a minute to collect the memory information, this had the side benefit of notifying me if the REST interface ever goes down. If I wanted to chart the REST interface’s response time, I’d add a separate HTTP check.

At NodePing, a lot of what we’ve built originated in our own experiences building and supporting Internet-based services. This is another example of how we have used our own monitoring systems internally to help us build and maintain our own systems.  If you  and haven’t tried out NodePing’s monitoring, check out our 15-day free trial.

HTTP Parse Check – Monitor Anything!

Most of the checks that we have released for NodePing to date have monitored specific Internet-based services. These are very useful, and they are the bread and butter of traditional web site and server monitoring services. Today we’re really excited to announce the release of our “Monitor Anything” check. You can use it to monitor… well, just about about anything.

The new check is the HTTP Parse check. It connects to a remote HTTP service and parses the response for specific fields and values. The values are then stored in the check results for reports. If any of the values are outside of your configured ranges, it triggers a notification via email, SMS, twitter, voice call, or webhook.

The HTTP Parse check can look for named fields in text or a JSON response. For example, if the check is configured to look for a field named “llamas” and the response contains llamas: 34 then the system will store 34 as the value, which will be displayed on reports and charts.

Similarly, the response could be in JSON format. For example, the JSON could be something like this: {"animals": {llamas": 34}} Configuring the check to look for animals.llamas will store 34 in the check results. The check can handle multiple fields, as long as they are all accessible from one request to a URL, and it can pull values from the middle of a larger response.

What could this check be used for? Anything that is accessible by an HTTP request that returns a field with a numeric value. Since it is parsing the response for the field name and value, it can be embedded in other data. This means that any JSON API or data service on the Internet is potentially a target for this.

Sample Server Load OutputOur use of this check at NodePing is to monitor server health. As you can imagine, running a service like NodePing means we have a number of servers all over the place. We use this check to monitor server load, free memory and disk space on a number of our servers.

There are many ways to generate the system information from a host so it can be used for this check. Some of the ones we’ve tried include Linfo and phpSysInfo. We wanted a similar tool written in Node.js, so we wrote npsystats, which is what we now use for our systems. We’ll have more to say about npsystats in the near future. There are a number of other similar tools out there, such as Ohai in Ruby. The HTTP Parse check is capable of working well with most of them.

For example, we have a check on a web server that monitors server load. npsystats returns the following json in response to the check’s HTTP GET request:
{"load":{"1min":1.86376953125,"5min":0.9501953125,"10min":0.64404296875}}
The check is set to watch three fields: load.1min, load.5min, load.10min, with a range of 0 to 8 (it could be different for each field, but it doesn’t have to be). So if the load on this server goes over 8, I will get an email. I also can access a graph showing the 1, 5, and 10 minute load for this server.

More information can be found in our documentation for the HTTP Parse Check. We think this makes NodePing an even more awesome piece of your system monitoring and automation toolkit, particularly when tied to judicious use of notifications and webhooks. If you don’t have an account on NodePing yet, try it out with our 15 day free trial.