New Performance Summary Report and Updated Public Reports

Web site developers spend a significant amount of time and effort optimizing the site so that it loads quickly and performs well for their visitors. All of that effort is wasted if the web server performs poorly. One of the key uses for website monitoring is keeping an eye on web server performance to make sure that piece of the visitor’s experience is working optimally.

NodePing Monitoring Results Summary Report
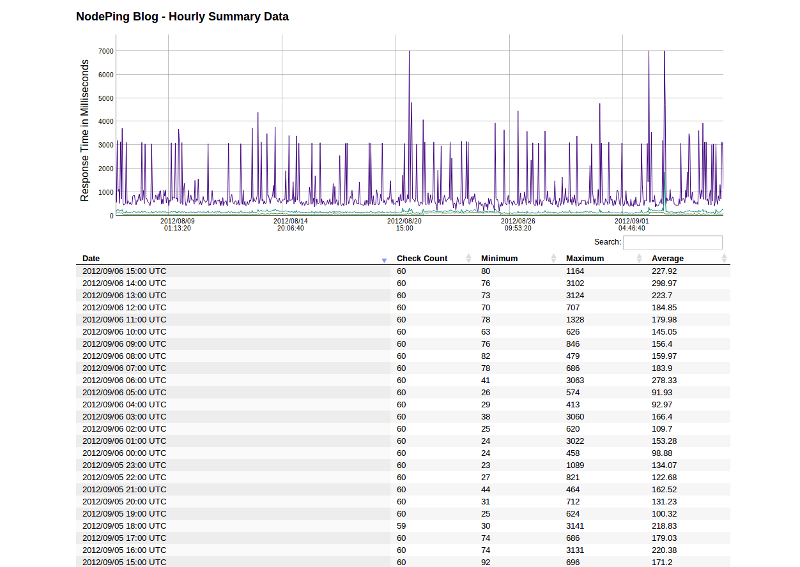
We have implemented a new report to help with this task. The Performance Summary report shows the minimum, maximum, and average response time for a site over an hour. By default, the report shows the last 31 days of performance data. As with the results report, you can change the number of results shown by editing the number on the report’s URL.

Of course, this isn’t limited to just web site performance. This report is available for all monitoring on NodePing, so you can see the same thing for ping results, ssh checks, email checks, and the whole range of other service monitoring we provide. In particular, this type of information is useful in ping tests to routers to watch connectivity performance over time.

We have also adjusted the way our “Public” reports feature works. The summary and results reports are now available if you are logged in to your NodePing account, even if the “Public” access is turned off. The “Public” toggle still controls whether the report is visible to visitors who are not logged in. We also changed the URL’s to better reflect that it is the same report with a different format. The results reports are now all at /reports/results/ (although the old URL’s will continue to work). You can retrieve the data in JSON or CSV format by adding ?format=csv or ?format=json to the URL. For CSV output, you can add a file name to the URL as well for convenience (so the URL would end in /filename.csv?format=csv). Documentation can be found in our reports documentation.

We are continuing to work on improving and expanding our reports. Please let us know what you think, and what you want to be able to see from the monitoring reports. Our continuing goal is to make NodePing not only the most cost effective, but also the most useful monitoring service anywhere.

Twitter Notifications

NodePing is happy to announce our newest notification method – twitter direct messages.  The ability to receive a twitter direct message is a great addition to our current notification system that already includes unlimited email, international SMS, and voice calls.

Twitter notifications are in testing at this point.  They are available on all accounts so please do kick the tires and let us know how things work for you at support@nodeping.com.

You’ll need to follow @NodePing in order to get direct message alerts.  Then add your twitter handle in your contact record and in your check’s notification section and we’ll send you a private and discrete ‘direct message’ (not an embarrassing public tweet) when that check goes down and again when it comes back up.

Let us know in the comments how this new notification type is working for you and what you’d like to see added next – instant message (IM), HTTP POST to url, carrier pigeon, etc?

Introducing NodePing’s Monitoring API

This is Part 1 in a series of posts we’ll have in the coming weeks detailing various aspects of NodePing’s new API. The API allows customers to manage most aspects of their site and server monitoring through an HTTP accessible RESTful interface. It provides list, read, write, and delete functionality for subaccounts, contacts, contact groups, and checks, as well as allowing you to retrieve checks and notifications. Access to the API is included in our service at no extra cost.

The API supports HTTP methods for most calls:

  • GET for listing or retrieving specific records,
  • PUT to update a record based on its ID,
  • POST to create new records (IDs are assigned automatically), and
  • DELETE to delete records.

All responses are JSON.

The API’s authentication is token based. You can find your token in the Account Settings area of your account, or if you’re logged in to the service it is also displayed on the Documentation page.

Documentation is available at https://nodeping.com/API_Documentation. Reference docs showing all supported calls are at https://nodeping.com/API_Reference.

Here’s an example of updating a monitoring check:
curl -X PUT -d'json={"threshold":4, "target":"http://www.example.com/index.html", "enable":"true", "notifications":[{"SKTUSP":"Days"}]}' 'https://api.nodeping.com/api/1/checks/201205050153W2Q4C-1FOC0YYM'

The response to that call would look something like this:

{
  "_id": "201205050153W2Q4C-1FOC0YYM",
  "_rev": "4-5069940f2a95fc6ae5564e329da755bd",
  "customer_id": "201205050153W2Q4C",
  "label": "Site 2",
  "interval": 1,
  "notifications": [ { "SKTUSP": "Days" } ],
  "type": "HTTP",
  "status": "modified",
  "modified": 1337744587374,
  "enable": "active",
  "public": false,
  "parameters": {
    "target": "http://www.example.com/index.html",
    "threshold": 4,
    "sens": "2"
  }
}

Since the API is brand new, we would really like to hear from people who start using it in real situations. Please let us know what works well, and what we could do to make interacting with the API easier.

SSH Check with Content String Matching

NodePing is happy to announce the new SSH check. In its simplest use, the new SSH monitoring provides a real SSH connection for monitoring those critical SSH services, but our check can do much more than that.

Not only can we monitor the availability of your SSH services on any port, but we can also optionally have the check log in and verify the presence, or absence, of a particular string in the login response. Pairing the SSH check with a login script makes it much more powerful and flexible. With it, you can monitor much more than SSH.

In the example below, we’re going to set a login script that checks server load, available memory, and disk usage. We’ll use its simple ‘PASS‘ or ‘FAIL‘ output to trigger email and SMS alerts from NodePing when the 1 minute load average goes over 4.0, when available memory drops below 50MB, or when the disk becomes more than 90% full.

The script is a simple BASH script that relies on commonly installed programs like ‘top’, ‘free’, and ‘df’ to determine the ‘PASS’/’FAIL’ status for each of the things we’re monitoring. It’s not the prettiest thing, but it seems to work well on an Ubuntu server.

#!/bin/bash
# Load average limit
# A quad-core server may be maxing out CPUs at 4.0
LOADLIMIT=4;
# Free memory floor in MB.
FREEMEMLIMIT=50;
# Disk usage in percentage, but without the percent sign. 
DISKUTILIZATION=90;
# Path to the disk partition you want to monitor.
DISKPATH='/dev/sda7';

LOAD=`top -n1 | grep 'load average' | awk -F" " '{print $12}'`;
LOAD=${LOAD:0:4}
LOAD=`echo "$LOAD > $LOADLIMIT" | bc`
if [ $LOAD -eq 1 ]; then
echo "LOAD:FAIL";
else
echo "LOAD:PASS";
fi

MEMUSAGE=`free -m | grep '^Mem' | awk -F" " '{print $4}'`;
MEMUSAGE=`echo "$MEMUSAGE < $FREEMEMLIMIT" | bc`;
if [ $MEMUSAGE -eq 1 ]; then
echo "MEM:FAIL";
else
echo "MEM:PASS";
fi
DISKSPACE=`df | grep "$DISKPATH" | awk -F" " '{print $5}'`;
LEN=`expr "$DISKSPACE" : '.*'`;
LEN=`echo "$LEN-1" | bc`;
DISKSPACE=${DISKSPACE:0:$LEN}
DISKSPACE=`echo "$DISKSPACE > $DISKUTILIZATION " | bc`;
if [ $DISKSPACE -eq 1 ]; then
echo "DISK:FAIL";
else
echo "DISK:PASS";
fi
# logout right away
# This SSH user is restricted for security purposes
exit;

We saved this script as ‘mylogin.bash‘ in our user’s home folder and then edited the /etc/passwd file, replacing the shell ‘/bin/bash‘ with ‘/home/testuser/mylogin.bash‘.  Don’t forget to make the script file executable with something like

chmod 0755 /home/testuser/mylogin.bash 

Now when our test user logs in, we see something like:

Last login: Thu Apr 12 22:41:33 2012 from 127.0.0.1
LOAD:PASS
MEM:PASS
DISK:PASS
Connection to 127.0.0.1 closed.

It’s the response text above that will be checked against our user defined content string. In our SSH check configuration, we’ll set the ‘Content string‘ dropdown to ‘Does not contain‘ and type ‘FAIL‘ in the text field.  Now when NodePing’s probe servers login via SSH and find the word ‘FAIL‘ in the response, I’ll get a notification!

But the notification just says that the SSH check failed. We won’t know what failed.  It could be the load, memory, or disk.  Instead of logging in to see, I’ll be lazy and create three separate SSH checks, all with the same host and login information, but have one check for the string ‘LOAD:FAIL‘, another check for ‘MEM:FAIL‘, and the other ‘DISK:FAIL‘.  I’ll label the one that checks the load average a nice informative name like “Load Average on test server” and the other checks something similar. Now my SMS notification say something like “SSH Check failed for: Load Average on test server“, letting me know exactly what’s failing.

NodePing provides 1000 checks run at up to 1 minute intervals for only $10/month so you’re running out of reasons not to monitor everything. If you don’t have a NodePing account yet, sign up for our free 15-day trial and kick the tires.  We think you’ll like it.

The above example is fairly simple.  You can write your own login scripts in Node.js, Python, etc to check statuses for databases, VPN connections, virus definition updates,… dang near anything!  You can find information on how to configure your SSH checks in our documentation.

How will you use the new SSH check with content string matching?  Let us know in the comments below.

NodePing Tips – Using the Status Filter

NodePing allows you to watch up to 1000 web sites or services. Some of our customers monitor dozens or even hundreds of web sites. Others monitor several web sites, plus DNS, FTP, SSH, and a variety of other services. The sites and services being monitored are surprisingly varied, and scattered across the globe.

Lately we’ve been working on our UI to make it work better for all of the variations in how the service is used, especially for customers with a larger number of checks. Several enhancements have been made to the main Status list. Putting more information at your fingertips.

One enhancement that is surprisingly powerful is the dynamic filtering of the status list. If you type in the Search box at the top right of the list, the list of checks is dynamically filtered as you type. The filter continues to be applied as the information is updated. This means, for example, that you can type “FAIL” in the search box and it will list only the services that are currently listed as failing. As services change from PASS to FAIL and back, they will appear and disappear from the filtered list dynamically. This gives you an instant list of those services that are failing that you can just keep on your screen and it keeps itself updated.

Another use of the search filter is viewing groups of checks with common attributes. For example, you can view all web site monitoring by typing http in the search, which will display all of the checks with an HTTP type or with “http” in the label. This is even more useful tied to careful use of check labels. If you include the word “router” in the label for all your checks of routers, that makes it very easy to list them together using the search. You could also use this to list monitoring checks of a specific network, client, or location.

The search filter is made possible by the capabilities of the DataTables plugin. Recent versions of DataTables have added some key features that have made our lives much easier in developing a rich interface for our web application.

We hope the new enhancements to our UI make the service even more useful, and we’re looking forward to hearing about the ways people use it that we didn’t think of.

Port Connect Check Now Available

There are thousands of network protocols NodePing doesn’t have checks for (yet) :-) But that shouldn’t stop you from being able to monitor the availability of your services.  Using our new Port Connect check, you can test the responsiveness of nearly any TCP protocol on any port.

This is great news for those running lesser-known services, or services on non-standard ports, who are having a hard time finding a monitoring service to help them track availability. Our Port Connect check will attempt to create a standard TCP socket connection to your host on the specified port and report back if your server accepted the connection.

The Port Connect check can also help ensure that a particular port is not accepting traffic as well. This is useful for making sure your firewall is blocking a specific port for services that need a little extra vigilance. The check will send a notification if it is ever able to successfully connect.

You can learn more about the Port Connect check and how to configure it in our documentation.  If you don’t yet have a NodePing account, you can sign up for a 15-day free trial and give our new Port Connect check a try.  We think you’ll like it.

FTP Check Now Looks for Files Too!

Until today, the NodePing FTP check was fairly basic but we’ve rolled up our sleeves to add the awesome sauce and are proud to announce our new and improved FTP monitoring check.

Features:

  • Monitor FTP on any port, not just 21
  • Supports anonymous logins
  • Verify FTP user logins (optional)
  • Verify the existence, or non-existence of a file on your FTP server (optional)

Detailed information about how to configure your FTP checks can be found in our documentation.

The “file exists” feature in particular can be a huge help for those who wish to do more than just check to see if their FTP service is currently running. We’ll send you a notification if that important file goes missing from your FTP service – or if a particular file suddenly appears! This can be used to receive an alert when an application error log file gets created.  Or you could write your own scripts for internal processes that trigger NodePing SMS alerts by touching files on your FTP server.

The new enhancements are available on your account now at NodePing.  If you don’t have a NodePing account, you can sign up today for a free 15-day trial and for $10 a month you can monitor 1000 servers and get unlimited email and international SMS alerts.

SSL Certificate Check

An SSL certificate is an important part of serving up secure websites. It puts the ‘S’ in HTTPS and gives your visitors that warm fuzzy feeling when they see that padlock in their browsers. But those SSL certificates don’t last forever. Most have to be renewed every 1-3 years and should you forget and let that certificate expire, your visitors will be met with an ugly “This Site is Untrusted‘ message instead of your great content. Let NodePing keep an eye on your SSL certificates with our new SSL check available today.

Monitoring your SSL certificate with NodePing will allow you to receive notifications if the certificates is nearing its expiration, is replaced with an invalid certificate, or if your webserver is incorrectly serving it. You can also configure how many days in advance of expiration you’d like to receive the notification, giving you time to renew and install a new certificate without interruption.

The new SSL check is just one more link in your comprehensive server monitoring chain. NodePing is happy to keep an eye on your SSL certificates. If you don’t have an account yet, sign up for a free 15 day trial at http://nodeping.com.

Let us know what you think of the new SSL check in the comments below.

Monitoring results now available in JSON and CSV formats

Many of our customers monitor their own customers’ websites, or they monitor services about which they have to periodically report availability and incident statistics. Many of them would like to include status information in their own dash boards or integrate results with other data in reports. All of that calls for the data to be available in formats that can be easily used by scripts, or easily imported into spreadsheets.

NodePing has now added the ability to retrieve monitoring results in JSON and CSV format. JSON is ideal for scripting situations, such as creating your own dashboards or views of the data. CSV is great for loading the results data into your spreadsheets for analysis or creating reports for customers or management.

Both of these formats are available as extensions to our public reporting feature, which we added a while back. When you turn on public reporting, you are given a UUID that identifies that check. The same UUID can be used to access the data as a public report (you need to know the UUID, which gives you some control over who sees it, but does not require a login), as JSON output, or as a CSV download.

You can read more about these features and see some sample URLs on our Reporting page in the NodePing Documentation.

Contact Groups added to NodePing

We have been getting a lot of great feedback and suggestions from our users over the months since we launched the NodePing monitoring service. One feature that many people have asked for is the ability to group contacts and assign notifications to groups of contacts rather than just to individuals. Today we’re excited to announce that we’ve added Contact Groups to the service.

You can now create a Group, assign individual addresses or phone numbers to each contact group, and then set the Group to receive notifications for individual checks. So, for example, you could create a Developers group and a Systems group and have each assigned to different sites or servers you are monitoring. Then if the makeup of that part of your team changes you can change who belongs to the group without having to change each of the notifications.

One way we use this feature in the NodePing team is to assign SMS numbers to a group called SMS. Then we can easily set notifications to all of our phones together. For us, SMS notifications generally mean “Do something about this now!” and it makes it easy to assign key services to this notifications contact group. You could also use it to group all of a person’s contact methods easily for notifications that should get to them wherever they are. So for example you could create a “Shawn” group and include all of Shawn’s email addresses and phone numbers in that group. Then notifications will automatically be sent to all of his addresses.

As with contacts, there is no limit on the number of contact groups you can use in NodePing. You can mix and match contact methods in all kinds of ways, to suit your particular needs. We’re happy to now get to use this feature ourselves, and we hope it will further enhance the usefulness of our service to you as well.

There are a few smaller enhancements and adjustments in the release today as well, and we have more coming. Thank you to everybody who has chosen NodePing for their server and website monitoring. Thank you also to everybody who has given us feedback and suggestions. Please keep them coming!