Monitoring the Server Room with NodePing – Part 2: Sense HAT
2023/08/29 Leave a comment
In Part 1, I talked about getting started with monitoring my server room with NodePing’s PUSH and AGENT checks and the Raspberry Pi. On my continued path of server room monitoring I wanted to look into environment monitoring with the Raspberry Pi and NodePing’s PUSH checks. To follow up, I sourced a Sense Hat so I could bring a simple way to monitor my climate and get alerts on the metrics with NodePing. The Sense Hat has the capability of monitoring temperature, humidity, and atmospheric pressure. In this post, I will look at how you can integrate the Sense Hat into server room monitoring, configure notifications, and the pros and cons I found when testing the Sense Hat.
The Hardware
To start, the Sense Hat has to be installed. My Sense Hat came with some extra screws and standoffs, as well as a GPIO riser. I’ll use them and a compatible case to secure my Raspberry Pi and Sense Hat. Once the pieces were assembled together, I installed Raspberry Pi OS to a microSD card. The easiest way is to use the Raspberry Pi Imager like in the previous blog post. I put the formatted microSD card in the Pi and connect Ethernet and power.
The Software
There is only one extra dependency that I needed, and it may even be installed on your Raspberry Pi already. To be sure, I installed it with this command:
$ sudo apt install sense-hat
That is all that is needed in addition to what is in the base installation of Raspberry Pi OS.
Creating the PUSH Check
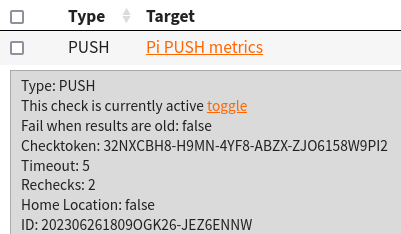
To start using the Sense HAT metrics with NodePing, I signed into NodePing and created a PUSH check. The check looks like this:

Below in the Fields section, the names should be:
- pisensehat.temp
- pisensehat.humidity
- pisensehat.pressure
Adjust the min/max values accordingly to what you consider a safe temperature. NodePing provides a Sense Hat Python 3 module for PUSH checks to monitor temperature, humidity, and atmospheric pressure called “pisensehat”. Not only will it submit the values to NodePing, but it also takes advantage of the Sense HAT’s LED array and will display basic environmental information so you can visually see the temp/humidity/pressure on the display.
User Setup
Out of the box, the first user I made belonged to the right groups to use the Sense Hat. However, I wanted to use a different user to run my PUSH client, so I ran this usermod command to add the pi user to the necessary groups to work with the Sense Hat:
$ usermod -aG video input gpio i2c piConfiguring the Client
Now that the check is created, I moved on to installing the PUSH client software on the Pi. To get the PUSH clients code, I can visit the GitHub page to download a zip file or I can use git to fetch the code directly using the following command:
$ git clone https://github.com/NodePing/PUSH_Clients.gitFrom here, I made a copy of the Python3 client. A convention I tend to follow is to create a folder named something like “server_room_climate_202306261808OGK26-JEZ6ENNW” where name is the label of the PUSH check in NodePing, and the check ID that is generated when you create that check in the NodePing web interface.
I created those folders using the command:
$ mkdir -p push-clients/server_room_climate_202306261809OGK26-09S996LVYou can call your folder whatever you want. I use this so I can easily find the right PUSH check in NodePing that corresponds to this PUSH client.
I will be using the pisensehat module to monitor my server room environment. The pisensehat module does a bunch of different things. It:
- Collects temperature, humidity, and pressure values
- Formats the data to send to NodePing
- Lets you control the LED array
- Turn it on/off
- Rotate the LED array
- Shows the status of your configured ranges for temperature(T), humidity(H), and air pressure(P):
- Red = higher than the safe configured range
- Green = within the safe configured range
- Blue = lower than the safe configured range
I copied the Python3 client code into the directory I made and cd’d into that directory for easier editing:
$ cp -r PUSH_Clients/Python3/NodePingPython3PUSH/* push-clients/server_room_climate_202306261809OGK26-09S996LV/
$ cd push-clients/server_room_climate_202306261809OGK26-09S996LV/
To make the PUSH check work, I have to edit 2 files:
- config.ini
- metrics/pisensehat/config.py
At the end of config.ini, there is a modules section. It should contain this information:
[modules]
pisensehat = yes
You also want to include your check ID and checktoken in the server section

Next is the config.py file for the module. Configure this to your own needs. Mine contains this information:
# True if you want to output colors to LED array
LED_ON=True

### ROTATION
# Rotate 0,90,180,270 degrees to change orientation of LED array
LED_ROTATION=90

### TEMPERATURES
# C for Celsius or F for Fahrenheit
UNIT="F"
# Colors status
MIN_OK_TEMP=60
MAX_OK_TEMP=90
# The SenseHat temp is off by a little but can be corrected
# to compensate for the CPU temp contributing some heat
TEMP_CALIBRATION = 1.0

### HUMIDITY
MIN_OK_HUM=30
MAX_OK_HUM=70

### PRESSURE
MIN_OK_PRESSURE=29
MAX_OK_PRESSURE=31
Important information of note:
- If you want the LED array to show you info, set this to
True - If the LED output is upside down you can change its rotation by modifying LED_ROTATION
- If you are submitting temps in Celsius, set
UNIT="C" - The min/max for TEMP, HUM, and PRESSURE should match what was entered when you created the PUSH check on NodePing. These values will determine the color output on the LED display
- I will talk more about TEMP_CALIBRATION later
The client should be configured now. I will now test it by running:
python3 NodePingPythonPUSH.py --showdata
This will let me see the data that would be sent to NodePing without actually sending it. This is just for testing and is a good way to make sure I edited those files correctly without impacting any uptime stats for the check in NodePing.
Lastly, I need to set up cron to run my PUSH client on a regular interval. I want this one to run every minute, so the cron line will look like the one below. To edit my cron tab, I run crontab -e and add the following entry:
* * * * * python3 /home/pi/push-clients/server_room_climate_202306261809OGK26-09S996LV/NodePingPythonPUSH.pyNow my check is running every minute and submitting my server room climate info to NodePing. This will allow me to track temperatures and humidity in the server room and notify me if the room is too hot/cold, humid/dry, and if the air pressure is too high/low.
Note on TEMP_CALIBRATION
While creating the pisensehat module for Python3, I noticed an odd problem with the Sense Hat that turns out to be a well known issue. The temperature sensor on the Sense Hat will change with the temperature of the processor. So if for example, you have a load average of 0.0 on the Raspberry Pi, the temperatures may be just 5 to 10F hotter than the actual ambient air. However, if the load goes up, the processor heats up and the temperature sensor will read much hotter. This will result in inaccurate readings for the room.
To best offset the temperature problem, I included a TEMP_CALIBRATION number in the config.py file. This is a best-effort method of calibrating the sensor to work with the current room temperature and account for the heat produced by the Pi’s processor. In my testing while running the NodePing AGENT and the pisensehat PUSH check, setting the value to 1.0 was relatively consistent with my other thermometers. The number could be different for you, and it is important to know that if your Pi’s load increases, so will your reported temperatures.
I have tried another sensor to work around the temperature issue with the Sense Hat, but I will save that for Part 3.
Another Issue
Another issue I came across in my Sense Hat testing was with the pressure sensor. The very first reading after boot seemed to report back a 0 no matter what. To fix this issue, the module reads from the pressure sensor two times to ensure it does not get and submit a 0.
Pi in the Wild
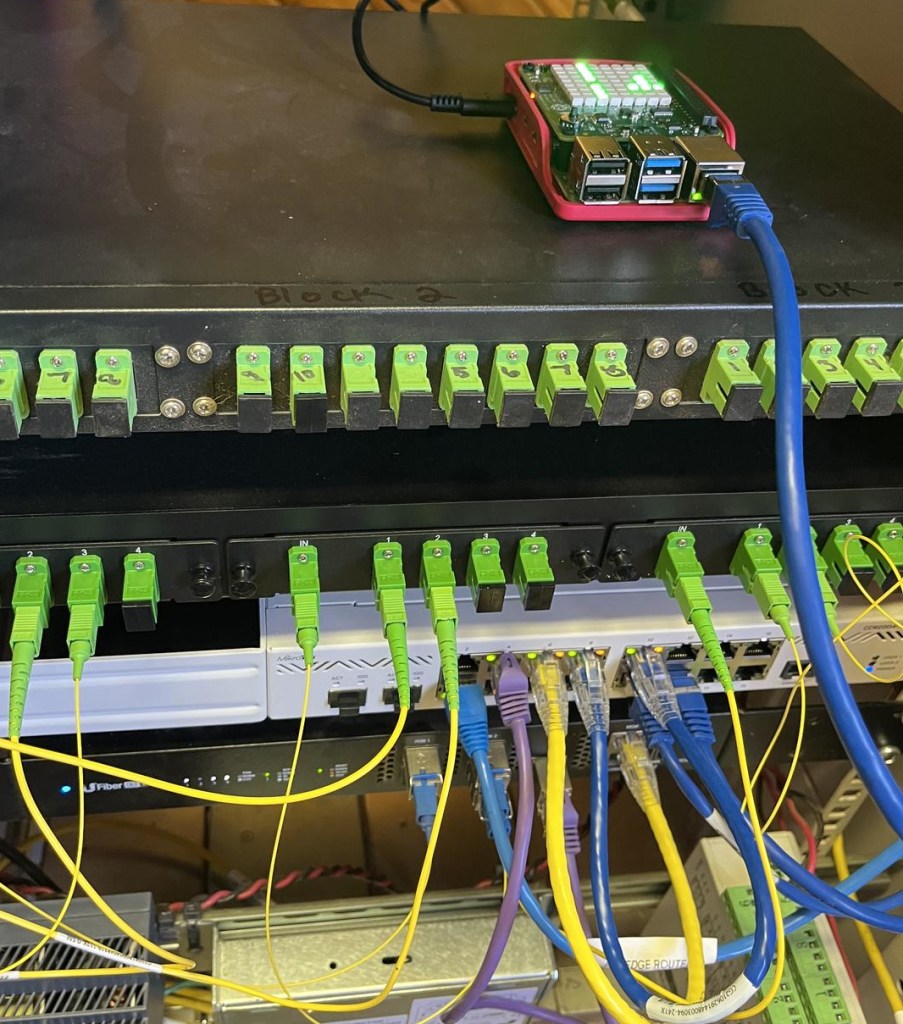
I have the Pi ready to go now. I took it to one of my networking rooms so I could monitor the environment in there. This room isn’t in any sort of datacenter so the conditions are more harsh with limited temperature and humidity regulation. The Raspberry Pi is perfect for this location so I can know if the air conditioning goes off, or if the humidity gets too low in the drier winter climate.
I connected the Pi to the switch and power and not long after starting up, the cron job started checking the environment and showed all green on the LED array. Success!
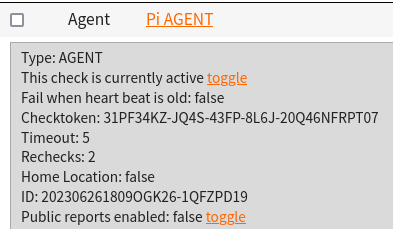
With the Raspberry Pi in place and monitoring my server room, I not only get the power of NodePing PUSH checks running on the Pi, but I also have an AGENT running to do some additional internal monitoring, as well as monitoring outbound connectivity.
If the temperature, humidity, or pressure fall outside of my configured ranges, I will be promptly alerted of the issue with the notifications I configured for the PUSH check. Additionally, if I am on premise, I can view the LED display to see if any of those environmental metrics is too high or low.
Check Status Reports
I like to have a visual graph of my environmental status so I created a status report page to get a visual representation in my browser of the environmental info from my check.
Now I have a live graph I can use to watch what is happening in my server room at this moment and over the last few hours. This is helpful for me to watch trends in my temperature, for example.
More to Come
Thanks to its versatility and availability of software packages, there is a lot that I can do with the Raspberry Pi to monitor my services and my surroundings. In Part 3, I will swap out the Sense Hat for a DHT22 sensor for monitoring instead of the Sense Hat to see if I can get better temperature readings without relying on mathematically offset values.
If you don’t yet have a NodePing account, please sign up for our free, 15-day trial.


