Public Status Report Update

NodePing’s public status report feature allows you to create an uptime report for your sites or services in your own domain. It’s a popular part of our website and server monitoring service, and is available on all NodePing accounts. Today we added a couple of (hopefully very useful) enhancements to the public status reports.

The report now has a column on the right side that shows the uptime for each service over the past 30 days. It also allows you to display a column to show the check type, which can be turned on and off in the report’s configuration page. Plus, we’ve also tweaked the filtering on the title field, which has opened it up to a wider degree of customization. For example, you can include image tags and style tags in this field, which allows you to add your logo, as well as having significant control over the overall look of the report.

The report already gave you the ability to set which checks should appear on the report, and to set a custom URL for the report (so, for example, you could have it on the status subdomain of your own domain, so the URL would be status.example.com). And if you have public reports turned on for individual checks, those reports will automatically be linked from the status report.

We hope that these enhancements, on top of the features we already had for the status report, will make this report very useful to all of our customers. We put a lot of emphasis on feedback from our users, so please let us know what other features would help you make the most of our monitoring service.

If you run web sites or other Internet services and haven’t tried out our monitoring service, give us a try with out 15 day free trial.

WebSocket Monitoring

We’re happy to announce a new check type that can monitor the uptime and optionally the response of your WebSocket services, including Socket.io.

WebSocket checks can monitor the availability of RFC-6455 and Socket.io (0.9.X) compatible WebSocket services. We use WebSockets here at NodePing to communicate between various servers. WebSockets are also commonly used as a low-overhead communication between the browser and web servers. One the greatest features of WebSockets is their ability to send information from the server to the browser without the browser asking for each piece individually, or having to handle each piece of data as a separate connection as popular polling methods must do. WebSockets are increasingly common for web applications and other cloud based services, but until now there hasn’t been a good way to monitor the availability of your WebSocket based services.

WebSocket URIs look a bit different from other protocols as they start with either “ws” or “wss”. “wss” is used for SSL connections. Socket.io requires some session information from an HTTP handshake before the WebSocket can connect so they start with “http” or “https”.

WebSocket checks are available to all NodePing accounts. Full documentation can be found here. If you’re not a NodePing customer yet, please sign up for our 15-day free trial.

We’d love to hear what kind of checks you need for your infrastructure. Send us your requests or leave a comment below.

How to integrate PagerDuty into NodePing

Many of our customers are also big PagerDuty fans. What’s not to like! PagerDuty offers great escalation and on-call hand-off capabilities as well as flexible voice, sms, and even pajama alerts.

To make it easier for you to integrate your already existing PagerDuty workflow, we’ve added a new contact notification type to NodePing. The ‘PagerDuty’ type accepts a ‘Service API Key’. You can find information on how to set up a PagerDuty generic API service at their support site.

Our system will send a ‘trigger’ event on each failure and a ‘resolve’ event on each recovery. Add an entry in your contact record by specifying your PagerDuty ‘Service API Key’ (they kind of look like a big random string “47b3a13848514c3fa3def842464eeaa8”) and selecting ‘PagerDuty’ in the notification type drop down. Then specify that contact when you edit or create your NodePing checks.

pagerduty

You can specify as many different PagerDuty contacts as you like. This allows you to use multiple ‘Services’ with NodePing and have full control of your PagerDuty escalations and notifications.

We strive to bring you the best solutions for your monitoring needs. We’ve set our eyes on Android and iOS push notifications next so follow this blog for that notification. We’d also love to hear from you. What notification types or other features would you like to see in NodePing?

If you’re not a NodePing customer yet, you can sign up for a free 15-day trial and kick the tires for yourself. We’re confident you’ll like what you find.

IP Address Changes – [LD]

Our probe server in London, United Kingdom [LD] will be changing IP addresses on 2013/12/09:
LD will change from 109.73.168.10 to 5.2.16.253.

No data loss is expected. We apologize for any inconvenience.
Please adjust your firewalls appropriately so your checks are not blocked.

A current and updated list of all the IP addresses for our probe servers can be found in the FAQ.

[UPDATE – 2013-12-09 13:29GMT-7] – LD IP address change complete

Adding Probe to EUR Region – CZ

As more of you are finding NodePing a great value for server monitoring, we’re needing to expand. Growth is good!

We’re adding an additional probe server to our European region on 2013-11-06.

Zlin, Czech Republic (CZ) – CZ (50.7.228.37)

Please update your firewalls appropriately.

We’d love to hear what locations or regions you’d like to see NodePing probe servers. Leave a comment below.

[UPDATE – 2013-11-06 14:33GMT-6] – Probe server is up and running

IP Address Changes – [NJ, CA, LD, NL, DE]

Our probe servers in the following locations will be changing IP addresses on 2013/10/01:
NJ will change from 108.61.56.241 to 192.3.25.36
CA will change from 173.255.243.111 to 173.254.226.131
LD will change from 89.32.145.126 to 109.73.168.10
NL will change from 46.249.33.15 to 176.56.238.119
DE will change from 78.47.40.108 to 130.255.191.151

No data loss is expected. There may be a few minute delay when any of your checks running on the current probe servers are moved to the new ones.

We apologize for any inconvenience.

Please adjust your firewalls appropriately so your checks do not fail because the probe IP addresses are blocked.

An always current and updated list of all the IP addresses for our probe servers can be found in the FAQ.

[UPDATE – 2013-10-01 20:12GMT-6] – All IP changes have completed

HTTP Advanced Check

Our HTTP checks for website monitoring at NodePing already include our standard HTTP Check, the HTTP Content Check that lets you verify that specific content is present or is not present in the page, and the HTTP Parse Check that allows you to track and alert on arbitrary data points in the response. Today we’re excited to announce that we’re adding the HTTP Advanced Check to our HTTP line up.

The new HTTP Advanced Check adds the following capabilities:

  • simulate a form POST to your web site and verify the expected response
  • check for arbitrary HTTP response status codes for custom API servers
  • send HTTP headers
  • verify specific HTTP headers are being received
  • send PUT, DELETE, HEAD, TRACE, or CONNECT methods

This will allow you to do more in-depth monitoring of your HTTP services. Use cases may include:

  • POST incorrect credentials to log in pages and verify the HTTP status code of 403 is returned.
  • Send mobile browser User-Agent headers and use the content checking to verify the mobile version of your site is being shown
  • Verify a PDF link is returning a PDF file by checking the return header for the correct ‘Content-Type’:’application/pdf’
  • Verify your redirect script is returning a 302 status code and not an error.

Additional information about this new check type can be found in our documentation.

The HTTP Advanced check is now available on all NodePing accounts. All accounts also include unlimited notifications, including international SMS. If you don’t have a NodePing account yet, please sign up for our free 15-day free trial.

Public status reports updated

We announced the initial release of our public status pages for our web site and server monitoring service a couple of weeks ago. These pages allow you to have a public status page for all of your servers and websites in one place. Since then, we’ve worked to add some additional enhancements that we think will be particularly useful.

First, we’ve added custom domains. This allows you to set up a URL such as https://status.example.com as your public status page. Just add a cname record to your DNS to point the domain to nodeping.com, and add the domain or subdomain to the report settings in your NodePing account (under Account Settings -> Reporting), and the custom URL will be available within 30 seconds or so. Once you have a custom domain set up, all of your public reports are available on that domain.

We’ve also added links to reports on individual check results. Any checks for which you have enabled public reports will include a link on the status page to go to the individual report. At the same time, we tweaked the individual results report so that the long list of results only shows if you click on the “Show Details” button. We got some feedback that the whole list is a little overwhelming, so we’ve made the information still available but not shown by default.

Finally, we’ve made a few cosmetic tweaks to the reports and to the reports settings page.

We have a number of additional features and enhancements we’re planning to add to these reports still, but we hope what we’ve done so far is already useful to everybody. As always, feedback and suggestions are welcome. Let us know what you think at support@nodeping.com, by posting comments here, or by using our Contact Page.

Public Status Pages

One of the frequent requests we get is for a public status page that lists the status of several server monitoring checks in one place. There is a lot to this particular feature, but we’re pleased to announce that the first version of this feature is now available on NodePing.

NodePing Status Report
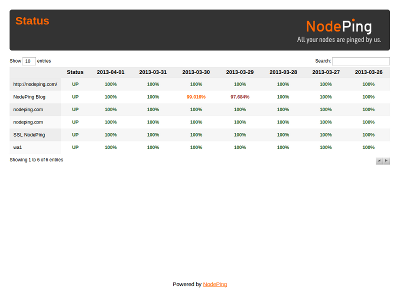
The status report allows you to select any of your active checks for listing on the status page. Any number of checks can be included. Just go in to the Reporting tab under Account Settings and select the checks you want to have displayed. The tab also shows the URL for your status report page.

The report has a “title” field, which is displayed at the top of the page. This field supports HTML, so you can add tags to style the look of the top of the page. That includes using an img tag to show your logo or other branding type information at the top of the page. For examples, you can look at https://nodeping.com/reports/status/MTSL1PQUZC and https://nodeping.com/reports/status/P9H0LI94W7. Script tags and other cross site scripting will be filtered. Provider accounts have additional control over the look of the page using the site branding features.

We didn’t want to just start publishing information without allowing people to opt-in to this featuer, so by default this report is not enabled. Enabling it is just a few clicks.

There are a number of additional features that we plan to add to this report, including more customization, links to individual check result pages, and custom URLs. In the meantime, feedback and suggestions are always welcome at support@nodeping.com.

IP Address Changes – [TX and NJ]

Our probe servers in Texas [TX] and New Jersey [NJ] will be changing IP addresses on 2013/04/02:
TX will change from 69.164.201.21 to 204.11.60.100
NJ will change from 96.126.109.97 to 108.61.56.241

No data loss is expected. There may be a few minute delay when any of your checks running on the current probe servers are moved to the new ones.
We apologize for any inconvenience.
Please adjust your firewalls appropriately so your checks are not blocked.

A current and updated list of all the IP addresses for our probe servers can be found in the FAQ.

[UPDATE – 2013-04-02] – The change is complete.